

Task Force 1: Macroeconomics, Trade, and Livelihoods: Policy Coherence and International Coordination
Economic Policy Uncertainty (EPU) has long been established as a reason for declining private domestic investment and firm performance in many economies. Policy uncertainty can arise due to unclear government rules regarding fiscal, monetary or trade policies. Unanticipated and frequent changes to rules can create volatility in economic policy. This Policy Brief uses news-based indices of EPU to study its spillover effect among G20 countries. It also identifies the directionality of the volatility spillover, using the financial connectedness frameworks present in finance literature. It finds that among 14 G20 countries, 23 percent of the average dynamic policy uncertainty can be explained by spillover from other countries; Australia, Brazil, Canada, China, India, Japan, South Korea, and the US are net exporters of policy uncertainty while the rest of the G20 are net importers of uncertainty. Furthermore, shocks to domestic EPU impact the export growth rate for up to two financial years.
1. The Challenge
The G20’s primary objective is to coordinate between its members for achieving global economic stability and sustainable growth. Accounting for 62 percent of global population, 82 percent of the world’s GDP, and 72 percent of trade, the G20 is an informal forum that focuses on international economic cooperation.[1],[2] According to estimates from the UN Comtrade,[3] the G20 bloc has an annual trade value of US$17 trillion, a big share of which is attributed to a few trading pairs. Such a high degree of trade will mean linkages in livelihoods as well.
This Policy Brief aims to understand the need for policy stability within the G20 to ensure protection of trade. The brief studies 14 of the 19 G20 countries—namely, Australia, Brazil, Canada, China, France, Germany, Italy, India, Japan, Mexico, Russia, South Korea, the United Kingdom, and the United States. Furthermore, it follows the ‘dynamic connectedness’ metrics, developed by researchers to understand cross-border spillover of uncertainty.[4]
The Policy Brief uses the Economic Policy Uncertainty (EPU) index as a metric for analysing the policy environment across G20 countries. Studies have established that domestic EPU originates in fiscal, monetary, and trade policies of countries.[5] It impacts the volatility of stock prices and can lead to reduced investment and employment. It has the potential to derail the growth trajectory of G20 countries, thereby impacting lives and livelihoods across the world. Various measures exist for EPU, such as implied stock price volatility and professional forecasters’ assessment of government purchases. The most prominent measure in recent times has been the news article-based index of EPU,[6] which is used in this present study.
Examining the impact of uncertainty has gained more importance since the 2008 financial crisis. The world economy has experienced a series of policy-related uncertainty shocks, such as the Eurozone debt crisis in 2011, the US fiscal cliff episode in 2012, Brexit in 2016, and the COVID-19 pandemic in 2019. Such sudden policy change not only affects the concerned country itself, but also others. In this regard, the Policy Brief assesses how the domestic uncertainty of individual countries in the G20 may spill over to uncertainty within the group. By extension, such spillover is bound to impact trade flows as well as investment, thereby affecting livelihoods.
Analysts have highlighted some potential channels for transmission of shocks due to EPU at macroeconomic and micro-agent levels. At the macro level, the channels include capital flows, bond-risk premiums, and exchange rates.[7] At the micro level, wait-and-watch actions by firms in relation to fixed investment and labour hiring can be conduits for uncertainty.[8] Policy uncertainty also influences financial policies and consumer spending, thus impacting output and employment.[9]
As a first step, this Policy Brief adheres to a highly cited study[10] to measure the pairwise directional spillover of policy uncertainty in the sample it covers. This will empirically establish the magnitude of the interrelationship in policy uncertainty. The brief then uses EPU to assess the impact on the export and import growth rate of each individual country. Such assessment will inform the starting point for the need for policy coherence among the G20 countries.
The analysis finds that for every country in its sample, on average, just under a quarter of EPU as a proportion is imported from abroad. Such imported as well as domestic dynamics of uncertainty resulted in poor trade performance for well over two years in many countries. The extent of loss is up to a five-basis point reduction in the export growth and a two-basis point reduction in import growth.
The fundamental challenge, therefore, relates to the coordination of economic policymaking within the G20 with twin objectives. The first objective is to ensure that policymaking supports the sustainable economic growth of all countries. The second is to have stable and predictable policies that improve financial stability and strengthen the global financial architecture.
2. The G20’s Role
A central objective of the G20 is to achieve policy coordination among members to attain sustainable global growth, alongside the creation of financial regulations and architecture that reduces risk. The G20 finance work stream has coordinated to achieve some notable agreements, including a common framework for debt treatment, a two-pillar solution for international taxation in a digitalised economy, and principles for quality infrastructure investment. However, in terms of macroeconomic coordination for policymaking, only the finance ministers and the Central Bank governors lead the finance track, which discusses macroeconomic cooperation. Yet, no agreements and principles are in place for coordinated fiscal, monetary, and trade policy-related action on the part of the G20 member countries.
Uncoordinated macroeconomic policy within the G20 can have potential costs for all member countries. This Policy Brief attempts to demonstrate how domestic policy uncertainty in any one of the G20 countries affects other member states. It aims to provide evidence of interlinkages in policy uncertainty, and investigate potential loss in one macroeconomic outcome, i.e. trade, comprising export and import in goods and services. The brief proposes the benefits of coordination for economic policy within the G20.
Economic Policy Uncertainty
The EPU index for each of the 14 countries is built on the basis of the newspaper coverage frequency for terms, such as ‘‘uncertainty’’ or ‘‘uncertain’’ and ‘‘economic’’ or ‘‘economy’’, present in widely read newspapers (see Table 2 in the Online Appendix). The index shows considerable cross-country correlation contemporaneously (see Figure 1). The EPU index is positively correlated for all countries in the sample, except Mexico, which has a slightly negative correlation. On closely observing the EPU index between 1997 and 2022 (Figure 2), one can notice that policy uncertainty has become increasingly elevated in the period following the 2008 global financial crisis. Notably, the upper middle-income country group has high volatility, followed by high-income countries; it is the smallest for lower middle-income countries.
Figure 1: Correlation of EPU Index Among the G20 Countries
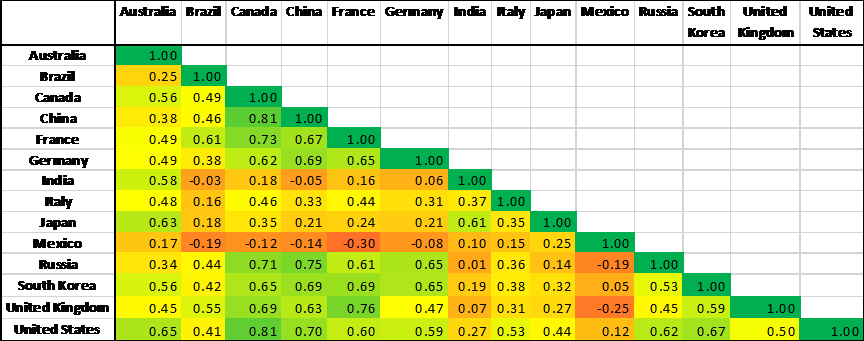
Source: Authors’ own, based on EPU data[11]
Spillover Index
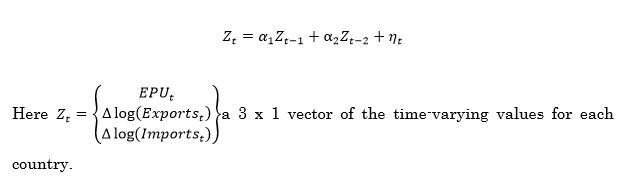
The first step in calculating the Spillover Index is to estimate an N-dimension Vector Auto Regression (VAR) model with two-period lag [VAR(2)].
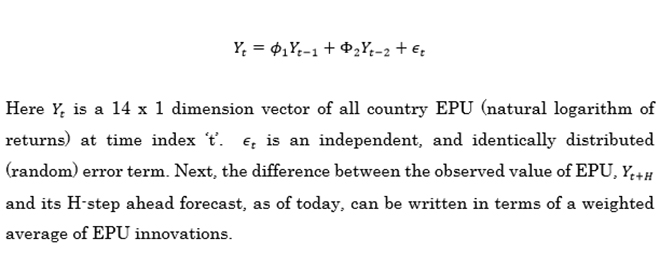
Some insights are drawn by perusing the coefficients of the VAR model. It is found that past period EPU (up to two lags) matters to current EPU for the majority of the countries, such as China, India, Italy, Russia, France, Germany, and Japan; in the rest of the countries, they die out within one period. China’s EPU has an outsized impact on other countries, with nine out of 14 impacted by it. The VAR coefficients are only consequential for the creation of spillover metrics, which will be discussed next.
The VAR model provides an opportunity to decompose the forecast error variance (fevd) in terms of coefficient matrices and error innovations (shocks to EPU). The H-period (3) ahead forecast error can be written as follows:

Figure 2: Evolution of EPU for the G20
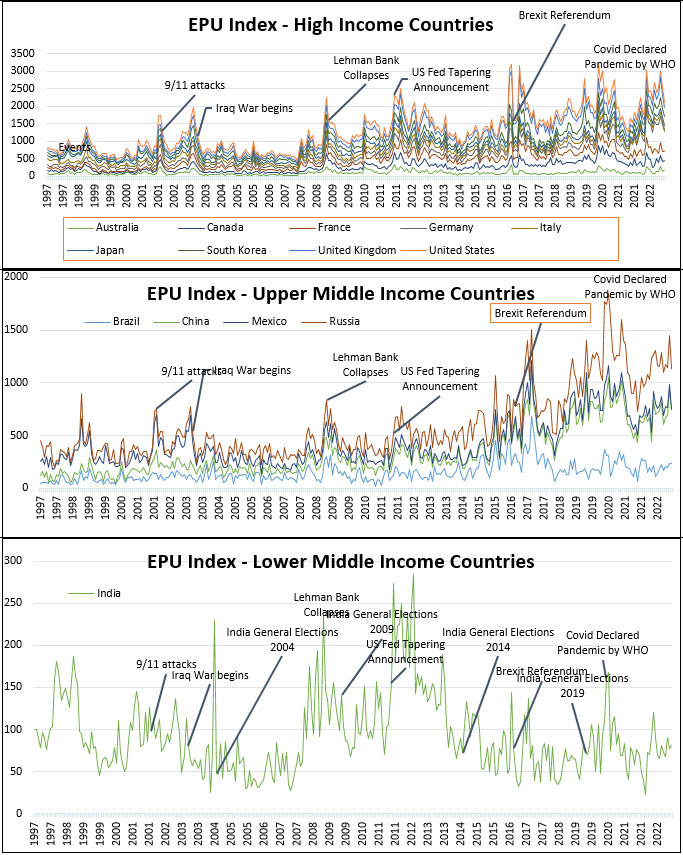
Source: Authors’ own, based on EPU data
The dynamic connectedness literature[12] exploits the forecast error’s covariance matrix and its Cholesky decomposition to compute two measures. The first measure, , which is considered the contribution of shocks of country j (say, China’s EPU) to country i’s (India’s EPU) forecast error variance; the second measure is an overall spillover index for all countries put together as listed in the online Appendix A1: Spillover Index.
This spillover index is replicated in Table 1 by making use of an algorithm, suggested in a widely cited study on dynamic inter-connectedness,[13] to attain the average directional spillover. The results in each column of Table 1 list what percentage of policy uncertainty spillover each country exported abroad in pairwise relation to the country in the row. Similarly, each row value indicates how much of policy uncertainty spillover originated domestically and what was imported from abroad. For instance, India’s domestic policy uncertainty was responsible for 79.41 percent of its own uncertainty, whereas shocks to Japanese EPU mattered the highest to India at 3.91 percent of forecast error variance. Indian policy uncertainty explains 5.28 percent of Australian forecast error variance of EPU.
Table 1. EPU Spillover Table (Select G20 Countries)
| AUS | BRA | CAN | CHI | FRA | GER | IND | ITA | JAP | MEX | RUS | SOU | UK | USA | INWARD TOTAL |
|
| AUS | 68.34 | 0.83 | 4.01 | 1.08 | 0.9 | 2.07 | 5.28 | 0.33 | 3.32 | 2.43 | 2.89 | 2.02 | 3.09 | 3.41 | 31.66 |
| BRA | 2.23 | 86.76 | 0.45 | 0.79 | 1.81 | 0.66 | 0.52 | 2 | 1.14 | 0.35 | 0.96 | 1.16 | 0.17 | 1.01 | 13.24 |
| CAN | 3.46 | 0.44 | 74.6 | 0.52 | 2.4 | 2.77 | 1.5 | 1.29 | 1.92 | 1.09 | 0.28 | 1.57 | 2.76 | 5.39 | 25.4 |
| CHI | 0.9 | 0.77 | 3.07 | 84.53 | 0.57 | 0.73 | 0.99 | 0.35 | 0.58 | 0.75 | 0.38 | 2.46 | 2.09 | 1.83 | 15.47 |
| FRA | 1.82 | 2.23 | 1.77 | 2.23 | 72.94 | 3.12 | 1.08 | 1.9 | 3.54 | 1.2 | 0.13 | 2.42 | 2.55 | 3.07 | 27.06 |
| GER | 3.71 | 0.72 | 2.61 | 3.57 | 3 | 72.76 | 1.4 | 0.69 | 1.89 | 1.34 | 0.22 | 1.7 | 2.71 | 3.67 | 27.24 |
| IND | 3.31 | 0.54 | 0.54 | 0.55 | 1.91 | 1.74 | 79.41 | 0.88 | 3.91 | 0.87 | 1.29 | 2.38 | 0.33 | 2.33 | 20.59 |
| ITA | 1.3 | 0.67 | 2.35 | 0.54 | 1.97 | 1.04 | 1.74 | 83.31 | 1.03 | 2.16 | 0.22 | 1.14 | 1.83 | 0.7 | 16.69 |
| JAP | 4.46 | 1.11 | 1.6 | 0.6 | 0.93 | 0.77 | 4.62 | 1.75 | 77.63 | 0.43 | 0.09 | 3.29 | 0.46 | 2.26 | 22.37 |
| MEX | 2.14 | 0.16 | 1.28 | 1.14 | 0.72 | 0.95 | 0.85 | 0.55 | 0.35 | 82.54 | 0.91 | 2.14 | 0.35 | 5.93 | 17.46 |
| RUS | 0.52 | 4.23 | 1.07 | 0.37 | 0.18 | 0.69 | 2.42 | 0.48 | 0.45 | 0.41 | 85.87 | 1.57 | 0.65 | 1.09 | 14.13 |
| SOU | 2.55 | 2.08 | 2.26 | 1.71 | 1.79 | 1.08 | 2.4 | 0.86 | 2.5 | 2.25 | 1.29 | 70.26 | 1.66 | 7.31 | 29.74 |
| UK | 4.21 | 0.6 | 4.13 | 3.71 | 2.61 | 2.49 | 1.11 | 1.13 | 1.69 | 0.54 | 0.56 | 1.75 | 72.67 | 2.8 | 27.33 |
| USA | 5 | 1.6 | 5.06 | 1.56 | 2.48 | 3.55 | 2.04 | 0.71 | 3 | 3.03 | 0.83 | 6.33 | 2.23 | 62.57 | 37.43 |
| EPU OUTWARD TOTAL |
35.62 | 15.98 | 30.19 | 18.37 | 21.27 | 21.66 | 25.96 | 12.91 | 25.34 | 16.85 | 10.04 | 29.94 | 20.89 | 40.81 | |
| NET (To – From) |
3.96 | 2.74 | 4.79 | 2.9 | -5.79 | -5.58 | 5.37 | -3.78 | 2.97 | -0.61 | -4.09 | 0.2 | -6.44 | 3.38 | SOI=
23.273 |
Source: Authors’ analysis on EPU data
The last row shows the net difference between Outward (the column total indicated by ‘To Others’) and Inward (the row total indicated by ‘From Others’) spillover, indicating if a country, overall, is a net exporter or a net importer of policy uncertainty. The analysis reveals that Australia, Brazil, Canada, China, India, Japan, South Korea, and the US are net exporters of uncertainty, whereas the rest of the 14 countries are net importers of uncertainty.
The overall average net spillover of policy uncertainty for the group of 14 countries in the Policy Brief’s sample is 23.27 percent, i.e. close to a quarter of one country’s uncertainty is imported from abroad. This indicates the level of interconnection among the G20 policy environments and how domestic policy uncertainty transitions across borders.
In the next part of the analysis, this Policy Brief employs a country-wise VAR(2) lag model to assess the impact on exports and imports owing to one standard deviation shock to the EPU index. It then assesses a three-period ahead forecast and plots the impulse response function for exports and imports on EPU innovation separately in Table 2 of the Online Appendix.
This Policy Brief finds that innovations in domestic EPU presage deterioration in trade performance for the majority of the G20 members. For countries which are net importers of policy uncertainty, we find around eight quarters of sustained negative impact on export and import growth rate. Canada, China, India, France, South Korea, the United Kingdom, and the US, all show a sustained fall in trade growth rates for up to two years for one standard deviation change in the policy uncertainty index (see Table 2 of the Online Appendix).
Some countries have a fluctuating effect, beyond the first quarter, perhaps owing to the seasonality of their commodity export cycle. Australia and Brazil, which are high commodity exporters, experience higher growth rates in one quarter after the EPU innovations.
In summary, these authors’ analysis of the EPU index and its impact on trade performance reveals that over a quarter of uncertainty spills over to member countries. Such spillover, combined with domestic uncertainty, has long-lasting effects on trade performance. Thus, the EPU index has utility as a leading indicator of trade performance, and consequently, there is a benefit gained from reducing policy uncertainty within each G20 member state.
3. Recommendations to the G20
The evidence shown in this brief does not warrant a cause-and-effect argument between the policy uncertainty index and macroeconomic performance. However, the results provide empirical proof of a strong interlinkage between the policy environment of the G20 countries and EPU volatility, foreshadowing poor macroeconomic performance.
The following are a few recommendations to help obviate the spillover effects owing to the volatility of economic policy.
- Every country in the G20 must contain its own domestic policy uncertainty by preparing policy plans and frameworks that are clear, long-term, and based on sound macroeconomic principles, such as having central banks target inflation and designating statutory limits to fiscal spending. Policymakers must also aim to make their actions predictable and limit obscurity in implementation.
- The G20 must strive to achieve policy coordination by agreeing on common minimum rules, related to communication of fiscal, monetary, and trade policies among all its members. Here, the authors highlight some insights from existing studies on policy coordination within the G20, particularly during crisis periods:
- Soon after the 2008 financial crisis, the G20 launched the Framework for Strong, Sustainable, and Balanced Growth (SSBG)[14] to coordinate economic policies for achieving sustainable growth, correcting global imbalances, and providing a more robust source of finance; the G20 Action Plan for Supporting the Global Economy through the COVID-19 Pandemic[15] lays down different strategies for international collaboration to deal with the pandemic.
- The G20 already has a common framework (CF) for debt treatment, under whose ambit, the Debt Service Suspension Initiative (DSSI), which provides debt relief to countries that sought help, is running. By 2023, however, only three countries have applied for relief.[16] Furthermore, the CF and the DSSI deal with only bilateral governmental claims. Researchers highlight potential improvements to the DSSI. First, given that the loans from the private sector are significant and create an impact, it is imperative that DSSI be extended to private lenders as well;[17] second, the CF should emphasise more debt transparency to achieve better coordination of creditors, and restructure debts equitably.[18]Yet, these activities are in response to a crisis. Many scholars have argued that active policy coordination should be made the centrepiece of G20 activity. The G20 must move from being a ‘crisis-buster’ to being a ‘steering committee’.[19] For instance, with the G20 in the driver’s seat, the International Monetary Fund (IMF) will see itself as an adviser with the goal of long-term macroeconomic stability.[20] To be sure, the G20 played a critical role in setting up the Financial Stability Board (FSB) to monitor national policies for stable and sustainable growth.
3. The G20 can act as a steering committee to allow for coordination on fiscal as well as monetary policy.
- On the fiscal revenue side, clarity on taxation is an important aspect. Governments must declare objective fiscal rules, which clarify tax laws, including aspects of coverage for digital multinational businesses. In 2021, 136 jurisdictions agreed on an inclusive framework on base erosion and profit shifting (BEPS). Under the first pillar, taxing rights on close to US$125 billion, belonging to 136 market jurisdictions, will be reallocated, of which a significant share may be under the jurisdiction of developing countries.[21] Under the second pillar, the global minimum corporate tax rate of 15 percent will be applied to businesses with revenue above 750 million euro. This will bring in tax policy certainty for both payees and administrators.
- On the fiscal expenditure side, joint fiscal consolidation (as opposed to unilateral action) improves the global pool of savings and investment, and leads to better growth for everyone, thus meriting fiscal policy coordination.[22] Furthermore, joint action on fiscal stimulus improves GDP and debt-to-GDP ratio.
- While assessing the scope and feasibility of international monetary policy coordination, researchers[23],[24] note some key challenges and benefits. Advanced economy (AE) monetary policy has irrefutably created capital flows, which led to upward pressure in exchange rates, causing spillover for emerging market economies (EMEs). EMEs responded with abrupt non-linear changes in exchange rates, which challenged financial stability worldwide. The G20 can, therefore, play a central role in helping the AEs internalise spillover effects into their monetary policy. As a steward, the G20 can have the IMF deliver an independent and credible assessment of alternative strategies with trade-offs that will help improve global efficiency. Notably, an assessment of an international monetary policy committee, which looks at the aggregate consequences of monetary policy, may be investigated.[25]
In summary, Economic Policy Uncertainty spillover exists within the G20, putting economic growth and trade at risk. The G20, as a steward, can coordinate economic policies for global growth by enlisting the support of institutions, such as the IMF. It can also strengthen ongoing efforts on fiscal policy-setting domestically and coordinate actions internationally.
Online Appendix
Visit the online appendix by following the hyperlink here for more details.
Endnotes
[1] Adam Triggs, “Macroeconomic Policy Cooperation and the G20.”, World Economy 41, no. 5 (2018): 1-33.
[2] Rebecca M. Nelson, “International Economic Policy Coordination at the G-7 and the G-20”, Congressional Research Service Report, Washington, D.C., 2020.
[3] United Nations Statistics Division, UN Comtrade. International Merchandise Trade Statistics, accessed March 10, 2023.
[4] Francis X. Diebold, and Kamil Yilmaz, “Measuring Financial Asset Return and Volatility Spillovers, with Application to Global Equity Markets.” Economic Journal 119, no. 534, (2009): 158–171.
[5] Elif C. Arbatli Saxegaard, Steven J. Davis, Arata Ito, and Naoko Miake, “Policy Uncertainty in Japan.”, Journal of the Japanese and International Economies, 64, (June 2022).
[6] Scott R. Baker, Nicholas Bloom, and Steven J. Davis, “Measuring Economic Policy Uncertainty.”, The Quarterly Journal of Economics 131, no. 4 (2016): 1593–1636.
[7] Stefan Klößner, and Rodrigo Sekkel, “International Spillovers of Policy Uncertainty.”, Economics Letters, 124, no. 3 (2014): 508–12.
[8] Nicholas Bloom, “The Impact of Uncertainty Shocks.”, Econometrica, 77, no. 3, (2009): 623–85.
[9] Saud Asaad Al-Thaqeb, and Barrak Ghanim Algharabali, “Economic Policy Uncertainty: A Literature Review.”, Journal of Economic Asymmetries, 20, no. e00133, (September 2019).
[10] Klößner and Sekkel, “International Spillovers of Policy Uncertainty.”, 509.
[11] “Monthly EPU Indices for 22 Countries”, Policy Uncertainty Indices, accessed April 1, 2023.
[12] Diebold and Yilmaz, “Measuring Financial Asset Return and Volatility Spillovers, with Application to Global Equity Markets.”, 162.
[13] Klößner and Sekkel, 510.
[14] IMF and OECD, “G20 Report on Strong, Sustainable, and Balanced Growth”, IMF annual meeting, October 2017, accessed April 6, 2023.
[15] IMF and OECD, “G20 Report on Strong, Sustainable, and Balanced Growth”, 3.
[16] Jose Siaba Serrate, “How to Improve the G20 Common Framework for Debt Treatment.”, Accessed July 3, 2023.
[17] IMF, “Questions and Answers on Sovereign Debt Issues,” accessed April 1 2023, 5.
[18] Serrate, “How to Improve the G20 Common Framework for Debt Treatment.”, (2023).
[19] Andrew F. Cooper, and Colin I Bradford, “The G20 and the Post-Crisis Economic Order.”, CIGI G20 Papers. CIGI G20 Papers, Waterloo, Canada, 2010, accesed April 6, 2023.
[20] Lesley Wroughton, “IMF Shifts Gears, Moves into Post-Crisis Mode | Reuters.” Reuters, 2009, accessed July 1 2023.
[21] OECD, “International Community Strikes a Ground-Breaking Tax Deal for the Digital Age – OECD,” 2021, accessed July 1 2023.
[22] Adam Triggs, “Macroeconomic Policy Cooperation and the G20”, 21.
[23] Jaromir Benes, Michael Kumhof, Douglas Laxton, Dirk Muir, and Susanna Mursula, “The Benefits of International Policy Coordination Revisited.”, IMF Working Papers, Vol. 13, 2013.
[24] Jonathan Ostry, and Atish Ghosh, “Obstacles to International Policy Coordination, and How to Overcome Them.”, IMF Staff Discussion Notes, Vol. 13, SDN, Washington, D.C, 2013.
[25] Barry Eichengreen, Mohamed El-Erian, Arminio Fraga, Takatoshi Ito, Jean Pisani-Ferry, Eswar Prasad, Raghuram Rajan, et al. “Rethinking Central Banking: Committee on International Economic Policy and Reform.” Brookings Report, September 2011, accessed April 1, 2023.

