Task Force 4: Refuelling Growth: Clean Energy and Green Transitions
In countries of the Global South, 2.4 billion people cook with solid fuels, resulting in 3.2 million premature deaths and economic losses of US$2.4 trillion annually. Liquefied petroleum gas (LPG) is considered to be a scalable transition cooking solution until renewable options become market-ready. Counter-intuitively, the transition from solid fuels to LPG, despite being a fossil fuel, could result in a 74-percent reduction in net climate effect. About 30 percent of firewood used globally for household cooking is unsustainably harvested, i.e. CO2 released is not transferred back in woody biomass form, resulting in net CO2 addition to the atmosphere. Other greenhouse gases like methane, and short-lived climate pollutants like black carbon are also co-emitted. Consumers are struggling to purchase LPG during periods of high inflation across the Global South. The G20 can support LPG use in five ways, including through the use of LPG carbon credits, to encourage the shift away from solid fuels.
1. The Challenge
Cooking with solid fuels presents some of the most pernicious challenges to the world, the gravity of which is seen in the staggering estimate of over 2.4 billion people with a primary dependence on traditional polluting (solid) fuels and technologies for cooking.[1] To illustrate, over 41 percent of the Indian population[2] and over 95 percent of the population in countries like Tanzania and Uganda primarily rely on solid fuels to meet their cooking energy requirements.
There is sufficient evidence of the detrimental effects of using solid fuels on health, the environment, and gender equity and equality. The associated premature deaths from household air pollution number 3.2 million people annually, a significant proportion of whom are women and children.[3] A heightened mortality risk due to illnesses such as pneumonia, lung cancer, ischaemic heart, and chronic obstructive pulmonary diseases is extensively reported.[4] Non-renewable wood fuels for cooking cause a gigaton of CO2 emissions, and burning residential solid fuels comprise 58 percent of black carbon emissions. They are also a significant contributor to household air pollution (HAP) due to incomplete combustion of solid biomass.[5]
Research also indicates that this is a gender problem: girls and women face increased exposure to solid fuels.[6] Cooking with solid fuels delays progress towards five of the UN Sustainable Development Goals (SDGs), namely, Goal 3 (Good health and wellbeing), Goal 5 (Gender equality), Goal 7 (Affordable and clean energy), Goal 13 (Climate action), and Goal 15 (Life on land).
The cost of inaction on health, gender, and climate and environment is US$2.4 trillion annually, of which ‘cost to health’ is US$1.4 trillion, ‘cost to women’ because of lost productivity is US$0.8 trillion, and the ‘cost to climate’ is US$0.2 trillion. Against this, an annual investment of US$150 billion in modern energy cooking services (MECS) for universal access, demonstrates the potential to make a significant difference at a fraction (6 percent) of the total cost of inaction.[7] Additionally, an estimated 100 million people who had previously moved to clean cooking energy solutions are at heightened risk of being pushed back to solid fuel dependence due to affordability concerns.[8]
Given the detrimental effects of solid cooking fuels and the associated economic costs, there have been efforts both nationally and internationally to hasten the transition to clean cooking energy. While the World Bank has allotted US$500 million for the Clean Cooking Fund to accelerate progress towards the 2030 Agenda,[9] and governments such as Rwanda, Indonesia, and India have spearheaded efforts towards ambitious targets of promoting LPG as a clean cooking fuel, there are persistent concerns around the affordability and accessibility of LPG across and within nations.[10]
The benefits of LPG as against solid fuels are many. For example, LPG has a lower HAP than solid fuels being a low-emission, clean combustion fuel. It is a time saver for heating and cooking, and reduces drudgery. The flames of LPG are simple to control and are steady at high, medium, and low heat, allowing for multitasking while cooking.[11] LPG has also proven to be one of the most viable and scalable clean cooking energy solutions when accompanied by strong government policy action and subsidies as well as private sector-fuelled innovation and engagement.[12] While awaiting renewable energy technologies for clean cooking, to achieve scalability as a long-term solution, targeted support towards interim solutions such as LPG are now required.
However, full benefits of LPG adoption are contingent on near-complete replacement of polluting fuels, and this cannot be assumed solely based on the presence of LPG in the household. This is because the exclusive use and complete adoption of LPG is hampered by various factors that include affordability of LPG refills, and their availability and accessibility—as against the free availability of solid fuels; as well as prevalent food and cooking habits.[13] Studies by researchers and organisations like the Council on Energy, Environment, and Water (CEEW) and The Energy and Resources Institute (TERI), both in India, have confirmed these observations through extensive surveys across several states of the country where stacking of fuels, and partial and intermittent use of LPG have been reported.[14]
More aggressive and tailored policies are therefore necessary for facilitating near-exclusive use of cleaner solutions.[15] Given the wide economic disparities and variations in foreign exchange rates (against the US dollar) in the Global South, it is imperative to perform country-level assessments to determine the optimal subsidy for each country. For instance, a recent study[16] carried out in India showed that household demand for LPG is highly sensitive to price as increased subsidy resulted in significant LPG refills. The study showed that a net price of US$3 per refill resulted in near-exclusive LPG use. This translates to a subsidy of about 75 percent at current prices.[17]
Furthermore, studies have emphasised the role of governments and financial institutions in prioritising financing mechanisms as well as mobilising funds to boost access to clean cooking fuels and technologies.[18]
fNRB and GHG Mitigation
The fraction of non-renewable biomass (fNRB) is an important metric for assessing the sustainability of bioenergy or biofuel production systems, as a lower fNRB value indicates a greater reliance on renewable biomass sources and a lower environmental effect. For instance, a fNRB of 0.3 indicates that 30 percent of the CO2 released into the atmosphere due to biomass burning does not revert to woody biomass form and contributes to net warming. Therefore, countries and regions with higher fNRB values indicate non-renewable harvesting of woody biomass, deforestation, and forest degradation.
A study in Mexico examined the expected mitigation of greenhouse gases (GHGs) and black carbon emissions in the transition from traditional biomass to clean fuels and improved cook stoves. Results show that focusing exclusively on quick LPG penetration does not deliver the largest GHG benefits because of stove stacking with traditional open fires; whereas a combination of improved cook stoves and LPG distribution in regions with high fNRB values provides the greatest benefits due to reduction in the use of traditional open fires. The highest cumulative mitigation potential was observed in those countries with the highest non-renewable fuelwood harvesting. The cumulative mitigation in these countries was seen at 35 percent of MtCO2e savings annually compared with business-as-usual estimates.[19] The study suggests that targeting higher fNRB areas would have the potential for maximum GHG mitigation.
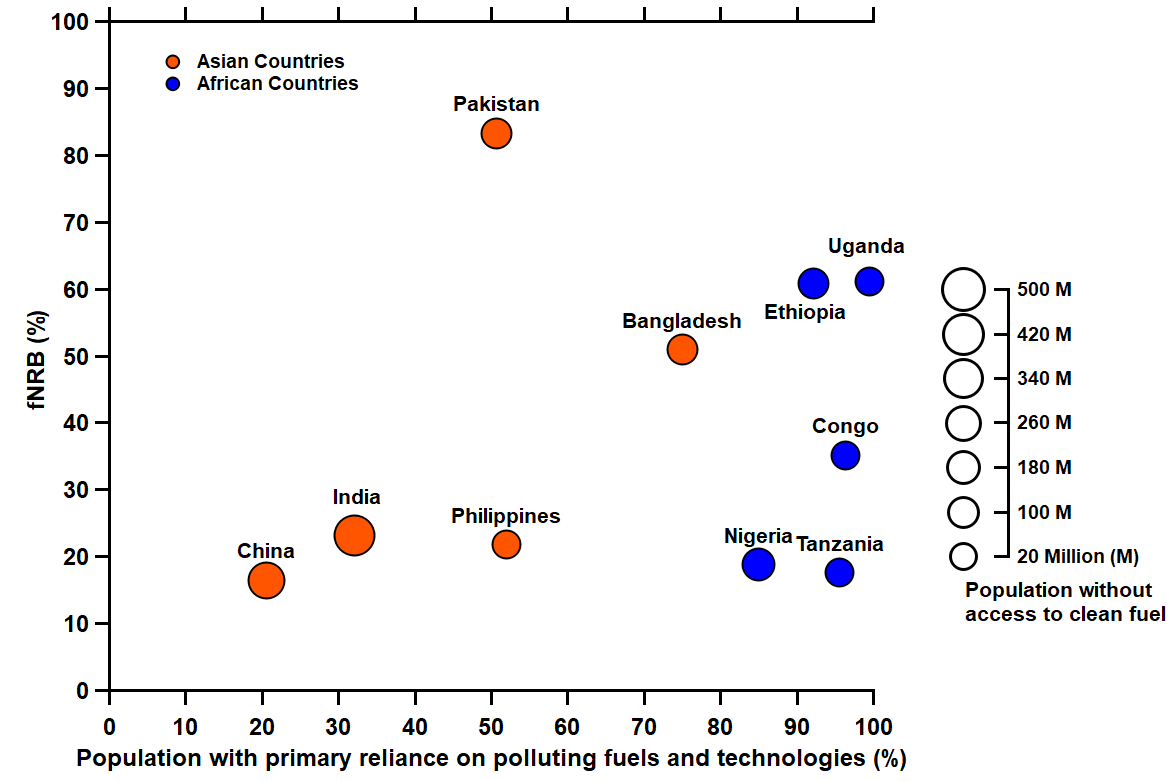
Figure 1: Global Snapshot of Top 10 Cooking Energy Poverty Hotspots*
Source: Authors’ analysis of multiple datasets detailed in Table A2 in Annexure I
* These figures are of the absolute population (in millions) without access to clean cooking and their corresponding fNRB values. (Supporting data is presented in Tables A1 and A2 in Annexure I.)
In Figure 1, the percentage of population that lack access to clean cooking energy (i.e. primary reliance on polluting fuels and technologies) is plotted against fNRB. Only the top 10 countries in absolute number of people lacking access to clean cooking energy are shown for visual clarity, and defined as ‘cooking energy poverty hotspots.’ Here, the term is indicative of people primarily relying on polluting cooking solutions due to accessibility constraints and unaffordability.[20]
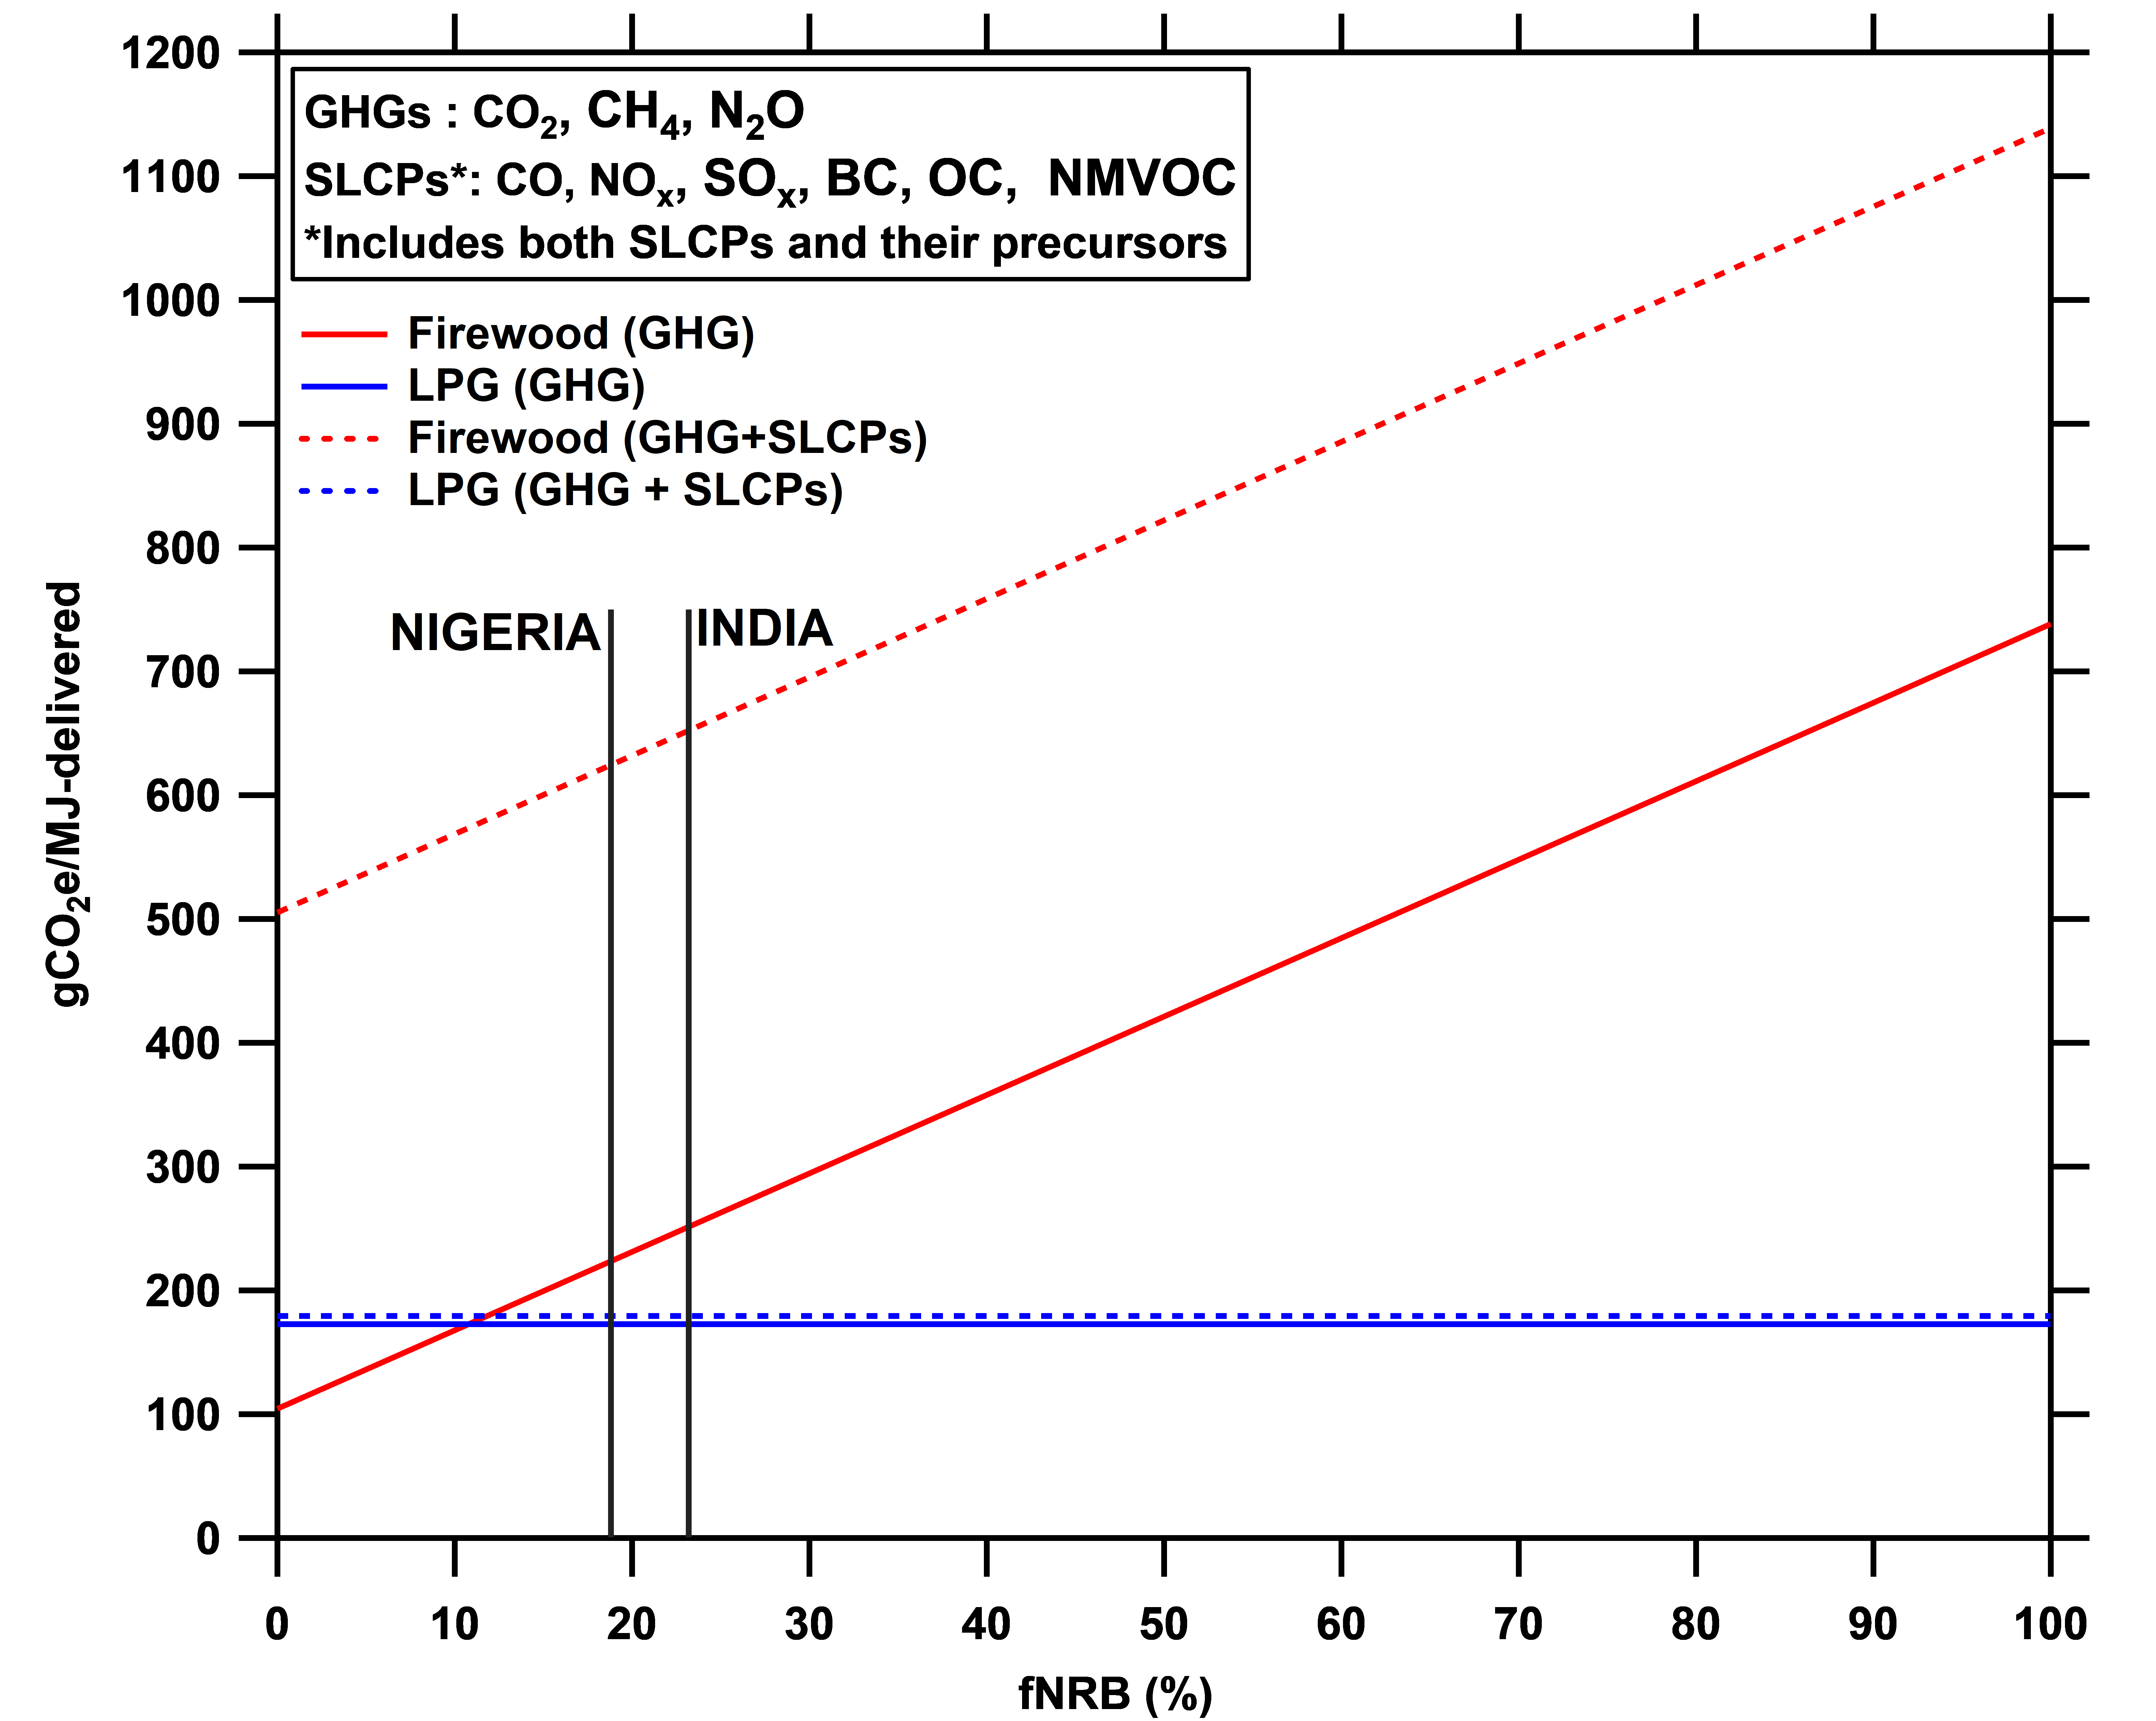
Energy poverty hotspots, specifically countries with fNRB >50 percent, such as Bangladesh, Ethiopia, Uganda, and Pakistan, are expected to benefit most by switching to LPG, resulting in 60–73 percent reductions in well-mixed GHG emissions and 78–83 percent reductions in GHG plus short-lived climate pollutants (SLCP) emissions as compared with the baseline of these four countries (Figure 2).
Figure 2: Net Climate Effects of Firewood Vs. LPG as Cooking Fuel#
Source: Authors’ analyses of multiple datasets detailed in Annexure II
# The fNRB of the largest cooking energy poverty hotspots in Asia (India) and Africa (Nigeria) have been shown as indicative examples. Calculations and sources are detailed in Annexure II—Tables A3, A4, and A5.
Figure 2 depicts the change in the net climate effects (emissions) of well-mixed GHGs as well as GHG plus SLCPs as a function of the fNRB for firewood and LPG fuels. The emission factors for LPG and firewood have been taken from data,[21] which are central estimates (mean) compiled from various field studies. That global warming potential (GWP) values for SLCPs and their precursors are associated with high uncertainties is acknowledged. For simplification and clarity, central estimates have been used for the calculations. If the fNRB is >11 percent, the net climate effect of cooking with LPG is lower than cooking with firewood. As LPG emits negligible amounts of SLCPs and fNRB is not relevant to climate effect of LPG emissions, the blue dotted line (both GHG and SLCPs) and blue solid line (GHG only) indicating net grams of carbon-dioxide-equivalent (gCO2e) emissions per unit of cooking energy delivered (in megajoule [MJ]) are nearly identical. For firewood, increased fNRB leads to higher net gCO2e emission per unit of cooking energy delivered (in MJ) when only GHGs are concerned. When both GHGs and SLCPs are considered, LPG has lower (carbon-dioxide-equivalent) CO2e emissions even at 0 percent fNRB. This analysis is in line with previous studies that showed significant climate benefits when households transition from firewood to LPG.[22]
Final cooking energy from one (14.2 kg) LPG cylinder is equivalent to burning 176 kg of firewood in a traditional cook stove. At 30 percent fNRB, one cylinder of LPG can reduce emissions by 47 kg CO2e (only GHG) or, 199 kg CO2e (GHG+SLCP) compared with firewood burning (Table A6). Assuming 1-ton CO2e fetching 8.2 € (Fairtrade minimum pricing) and 1 € = 90 INR, carbon credit can provide INR 35 (GHG) and INR 147 (GHG+SLCP) worth of discount to end users per (14.2 kg LPG) cylinder (Figure A1).
2. The G20’s Role
Access to clean cooking energy has been a priority for several G20 presidencies. The most recent G20 Bali Leaders’ Declaration acknowledged “the range of pathways to improve energy access, including but not limited to providing solutions in clean cooking.”[23] The G20 Energy Access Plan envisaged during the 2015 Turkish G20 presidency included incorporation and prioritisation of household energy.[24] Furthermore, the 2016 G20 Energy Ministerial Meeting in Beijing reiterated the urgency for expanding energy access, with clean cooking energy being an integral part of it.[25]
The G20 Bali Leaders’ Declaration also underlined the G20 as a platform for promoting the scaling up of modern and clean energy technologies, boosting energy accessibility, and ensuring the stability of energy markets through interim support to mitigate price increases.[26] Therefore, boosting access to and providing price stability for LPG as a clean cooking solution fit well in the G20 agenda.
3. Recommendations to the G20
The G20 should support countries of the Global South that are keen on promoting the transition from firewood to LPG as an interim measure. Within these countries, priority should be given to those with both high fNRB and large populations sans clean cooking energy access. The G20 Energy Transition Working Group should therefore consider the following recommendations.
- Knowledge sharing and capacity building according to the unique requirements of countries across the Global South that are interested in scaling up access to and use of LPG. Some G20 countries like India and Indonesia have made extraordinary efforts to scale up LPG access in recent years. For example, India has a mature LPG market with extensive infrastructure and information systems and has provided 95 million women facing abject poverty access to LPG in the last seven years under the Pradhan Mantri Ujjwala Yojana. To this end, the G20 can facilitate knowledge sharing between countries like India and those interested in scaling up LPG access for a South–South cooperation. It would allow the emerging economies of the Global South to not spend scarce resources on reinventing the wheel by emulating the lessons that countries like India have already learned the hard way as they scaled up their LPG operations.
- Support the development of an information repository that reflects the present LPG market conditions following the COVID-19 pandemic. Within the Global South, there are significant differences in purchasing power, government capacity towards subsidy provision, foreign exchange rates, and export dependence. It would help estimate the optimal subsidy for the nation that would drive primary and exclusive use of LPG. Such a database would empower the G20 leadership (also, carbon credit buyers and other donor institutions) to decide on the form and quantum of support given the unique requirements and constraints of a country within the Global South.
- In line with the Bali Declaration’s emphasis on equity to achieve the SDGs, the G20 should explore the possibility of engaging with the Organisation of the Petroleum Exporting Countries (OPEC) to provide concessionary rates for LPG supply for domestic cooking purposes to the poorest countries in the Global South with high levels of fNRB, more so given the high inflation post-pandemic. Several countries in the G20 are the largest consumers of OPEC petroleum products and thus could have some form of influence in these discussions. It can be in extending the volume-based discount rates to these countries, price guarantee extended to the poorest countries when price shocks occur, or any other mechanism that provides price stability to the Global South.
- The G20 may explicitly promote a mature, proven, and scalable technology like LPG as an interim measure under Article 6.2 that allows countries to trade emission reductions with one another through bilateral or multilateral agreements. The Gold Standard Foundation has also established a quantification and monitoring methodology called the ‘Technologies and Practices to displace decentralised thermal energy consumption’ (TPDDTEC) to calculate emission reductions in switching over from non-renewable biomass to LPG.[27]As noted earlier, several studies have shown the accrual of significant climate benefits when communities switch from firewood to LPG.[28]
- Establish a fund to provide viability-gap funding to the Global South nations keen on expanding LPG distribution infrastructure and making LPG affordable for their citizens as an interim measure. It may be results-based financing wherein the support can be explicitly linked to verifiable progress in LPG adoption. The fund may also be used to protect the most vulnerable countries from steep forex fluctuations and LPG price shocks to ensure price stability for their consumers.
To conclude, the above support measures from the G20 for the LPG ecosystem are only proposed as an interim and near-term measure until non-fossil fuel energy sources become scalable and mature in the Global South. While there are significant ongoing efforts in making renewable energy solutions for clean cooking available, there is an urgent requirement to support the transition from firewood to a mature technology like LPG to ensure that SDGs are achieved by 2030. The G20 may also support technology and market development for such renewable-energy-based clean cooking technologies.
Attribution: Abhishek Kar et al.,” Promoting the Use of LPG for Household Cooking in Developing Countries,” T20 Policy Brief, July 2023.
The authors acknowledge the research support from Adya Sharma and Sunil Mani from the Council on Energy, Environment and Water (CEEW), New Delhi. The authors also thank the Director, CSIR–National Environmental Engineering Research Institute (CSIR–NEERI) for supporting this research. The manuscript has been checked for similarity with iThenticate software (KRC No.: CSIR-NEERI/ KRC/2023/MARCH/ERMD/1).
Annexure I
Table A1. Countries with the largest population without access to clean cooking energy and their corresponding fNRB Values.
| Country | Population without access to clean cooking energy | Fraction of non-renewable biomass |
| India | 447,284,300 | 23.2 |
| China | 290,946,160 | 16.5 |
| Nigeria | 179,690,598 | 18.8 |
| Bangladesh | 124,727,621 | 50.9 |
| Pakistan | 114,176,364 | 83.3 |
| Ethiopia | 108,681,880 | 60.9 |
| Democratic Republic of Congo | 88,960,001 | 35.2 |
| Tanzania | 58,731,008 | 17.6 |
| Philippines | 57,744,393 | 21.8 |
| Uganda | 46,887,915 | 61.1 |
| Kenya | 44,263,490 | 36.7 |
| Indonesia | 42,836,077 | 41.1 |
| Myanmar | 37,679,135 | 4.4 |
| Vietnam | 34,064,584 | 11.7 |
| Mozambique | 30,522,730 | 39.6 |
Table A2. Data sources used for Table A1 and Figure 1.
| Data Sources | Link | Source | Description | Notes |
| Population | https://data.worldbank.org/indicator/SP.POP.TOTL?end=2021&start=2021&view=map | United Nations Population Division. World Population Prospects: 2022 Revision | United Nations Population Division. World Population Prospects: 2022 Revision | |
| Percentage Access to clean fuel | https://www.who.int/data/gho/data/themes/air-pollution/household-air-pollution | World Health Organisation | WHO dataset | Population without access to clean fuel is derived from the total population and percentage access to clean fuel datasets. The population without access to clean fuels implies that they are primarily dependent on polluting solid fuels |
| fNRB | https://www.nature.com/articles/nclimate2491 | Bailis, R., Drigo, R., Ghilardi, A. et al. The carbon footprint of traditional woodfuels. Nature Clim Change 5, 266–272 (2015). https://doi.org/10.1038/nclimate2491 | Table 3 of SI.: https://static-content.springer.com/esm/art%3A10.1038%2Fnclimate2491/MediaObjects/41558_2015_BFnclimate2491_MOESM266_ESM.pdf | Average of low plantation and high plantation variants |
Annexure II
Table A3. Central estimates (mean) of LPG emissions across the value chain
| Pollutants | LPG Extraction | LPG processing | LPG Transport | LPG End Use Emission Factors g/MJ | Total Emission from LPG (g/MJ energy delivered) |
| CO | 0.02 | 0.01 | 0.01 | 0.53 | 0.57 |
| NOx | 0.02 | 0.01 | 0.06 | 0.08 | 0.17 |
| PM10 | 0.00 | 0.00 | 0.00 | 0.00 | 0.00 |
| PM2.5 | 0.00 | 0.00 | 0.00 | 0.01 | 0.01 |
| SOx | 0.01 | 0.03 | 0.02 | 0.00 | 0.06 |
| BC | 0.00 | 0.00 | 0.00 | 0.00 | 0.00 |
| OC | 0.00 | 0.00 | 0.00 | 0.00 | 0.00 |
| CH4 | 0.18 | 0.03 | 0.01 | 0.01 | 0.23 |
| N2O | 0.00 | 0.00 | 0.00 | 0.00 | 0.00 |
| CO2 | 10.69 | 11.78 | 6.41 | 136.67 | 165.55 |
| NMVOC | 0.01 | 0.01 | 0.01 | 2.11 | 2.14 |
Source: Floess et al. 2023.
Note: 0.00 g/MJ implies either zero or <0.01 g/MJ emission
Table A4: Central estimates (mean) of firewood emissions across the value chain. It is assumed that firewood is locally and manually sourced and does not have any impacts during extraction, processing and transport.
| Pollutants | Firewood extraction | Firewood processing | Firewood transport | Firewood end use emission factors g/MJ | Total emission from Firewood (g/MJd) |
| CO | 35.94 | 35.94 | |||
| NOx | 0.05 | 0.05 | |||
| PM10 | 17.60 | 17.60 | |||
| PM2.5 | 4.25 | 4.25 | |||
| SOx | 0.14 | 0.14 | |||
| BC | 0.67 | 0.67 | |||
| OC | 1.79 | 1.79 | |||
| CH4 | 3.87 | 3.87 | |||
| N2O | 0.00 | 0.00 | |||
| CO2 | 633.67 | 633.67 | |||
| NMVOC | 3.90 | 3.90 |
Source: Floess et al. 2023.
Table A5: GWP-100 values used in this study
| GWP 100 values for well-mixed GHGs | ||||
| Species | GWP-100 value | Source | Link | Details |
| CO2 | 1 | IPCC AR6 – Working Group 1 – Chapter 7 | https://www.ipcc.ch/report/ar6/wg1/downloads/report/IPCC_AR6_WGI_Chapter07.pdf | Page 95/132 of the document. Page 1017 of the report. Table 7.15. GWP 100 values are considered. |
| CH4 – fossil fuel (LPG) | 29.8 | IPCC AR6 – Working Group 1 – Chapter 7 | https://www.ipcc.ch/report/ar6/wg1/downloads/report/IPCC_AR6_WGI_Chapter07.pdf | Page 95/132 of the document. Page 1017 of the report. Table 7.15. GWP 100 values are considered. |
| CH4 – non fossil fuel (firewood) | 27 | IPCC AR6 – Working Group 1 – Chapter 7 | https://www.ipcc.ch/report/ar6/wg1/downloads/report/IPCC_AR6_WGI_Chapter07.pdf | Page 95/132 of the document. Page 1017 of the report. Table 7.15. GWP 100 values are considered. |
| N2O | 273 | IPCC AR6 – Working Group 1 – Chapter 7 | https://www.ipcc.ch/report/ar6/wg1/downloads/report/IPCC_AR6_WGI_Chapter07.pdf | Page 95/132 of the document. Page 1017 of the report. Table 7.15. GWP 100 values are considered. |
| GWP 100 values for SLCPs | ||||
| Species | GWP-100 value | Source | Link | Details |
| CO | 1.9 | IPCC AR5 – Working Group 1 – Chapter 8 | https://www.ipcc.ch/site/assets/uploads/2018/07/WGI_AR5.Chap_.8_SM.pdf | Page 39, Table 8.SM.17, GWP-100 column |
| NOx | -10.8 | IPCC AR5 – Working Group 1 – Chapter 8 | https://www.ipcc.ch/site/assets/uploads/2018/07/WGI_AR5.Chap_.8_SM.pdf | Page 39, Table 8.SM.17, GWP-100 column |
| SOx | -38.4 | IPCC AR5 – Working Group 1 – Chapter 8 | https://www.ipcc.ch/site/assets/uploads/2018/07/WGI_AR5.Chap_.8_SM.pdf | Used SO2 metrics instead of SOx |
| BC | 658.6 | IPCC AR5 – Working Group 1 – Chapter 8 | https://www.ipcc.ch/site/assets/uploads/2018/07/WGI_AR5.Chap_.8_SM.pdf | Page 39, Table 8.SM.17, GWP-100 column |
| OC | -66.4 | IPCC AR5 – Working Group 1 – Chapter 8 | https://www.ipcc.ch/site/assets/uploads/2018/07/WGI_AR5.Chap_.8_SM.pdf | Page 39, Table 8.SM.17, GWP-100 column |
| NMVOC | 4.08 | Fry, M. M., Schwarzkopf, M. D., Adelman, Z., and West, J. J.: Air quality and radiative forcing impacts of anthropogenic volatile organic compound emissions from ten world regions, Atmos. Chem. Phys., 14, 523–535, https://doi.org/10.5194/acp-14-523-2014 , 2014. | https://acp.copernicus.org/articles/14/523/2014/acp-14-523-2014.pdf | Page 8, Table 4. GWP-100 value for India region (IN) |
Table A6: Calculations for 1 LPG cylinder equivalent (14.2 kg), wood savings and emission mitigation
| Description (units) | Value | Source/comments |
| Assumptions | ||
| Useful energy in 1 cylinder (MJd/cylinder) | 385 | Kar et al. 2019 |
| Energy in 1 kg wood (MJ/kg) | 14.4 | Kar et al. 2019 |
| Efficiency of cookstove | 0.15 | Kar et al. 2019 |
| Useful energy in 1 kg wood (MJd/kg) | 2.16 | |
| kg wood equivalent of cylinder | 178.2 | kg wood/cylinder |
| Emissions | ||
| Wood GHG emissions (gCO2e/ MJd) | 294 | 30 percent fNRB (Figure 2) |
| LPG GHG emissions (gCO2e / MJd) | 173 | Figure 2 |
| Wood GHG + SLCP emissions (g CO2e / MJd) | 695 | 30 percent fNRB (Figure 2) |
| LPG emissions GHG + SLCP (gCO2e / MJd) | 179.2 | Figure 2 |
| GHG emissions per cylinder (kg CO2e) | 66.46 | |
| GHG + SCLP emissions per (kg CO2e) | 69.00 | |
| GHG emissions from 178.2 kg wood (kg CO2e) | 113.42 | At 30 percent fNRB |
| GHG + SLCP emissions from 178.2 kg wood (kg CO2e) | 267.68 | At 30 percent fNRB |
| GHG mitigation per cylinder (kg CO2e) | 46.95 | Difference of firewood and LPG emissions |
| GHG+SLCP mitigation per cylinder (kg CO2e) | 198.68 | Difference of firewood and LPG emissions |
| Value of carbon credits generated for GHG (INR) | 30.1 | Assuming 1-ton CO2e = 8.2 € (Fairtrade minimum pricing); 1 € = 90 INR
Source: www.goldstandard.org/blog-item/carbon-pricing-what-carbon-credit-worth |
| Value of carbon credits generated for GHG+SLCP (INR) | 127.2 | |
Figure A1: Potential of Carbon Credit Based Discount for 1 (14.2 kg) LPG Cylinder
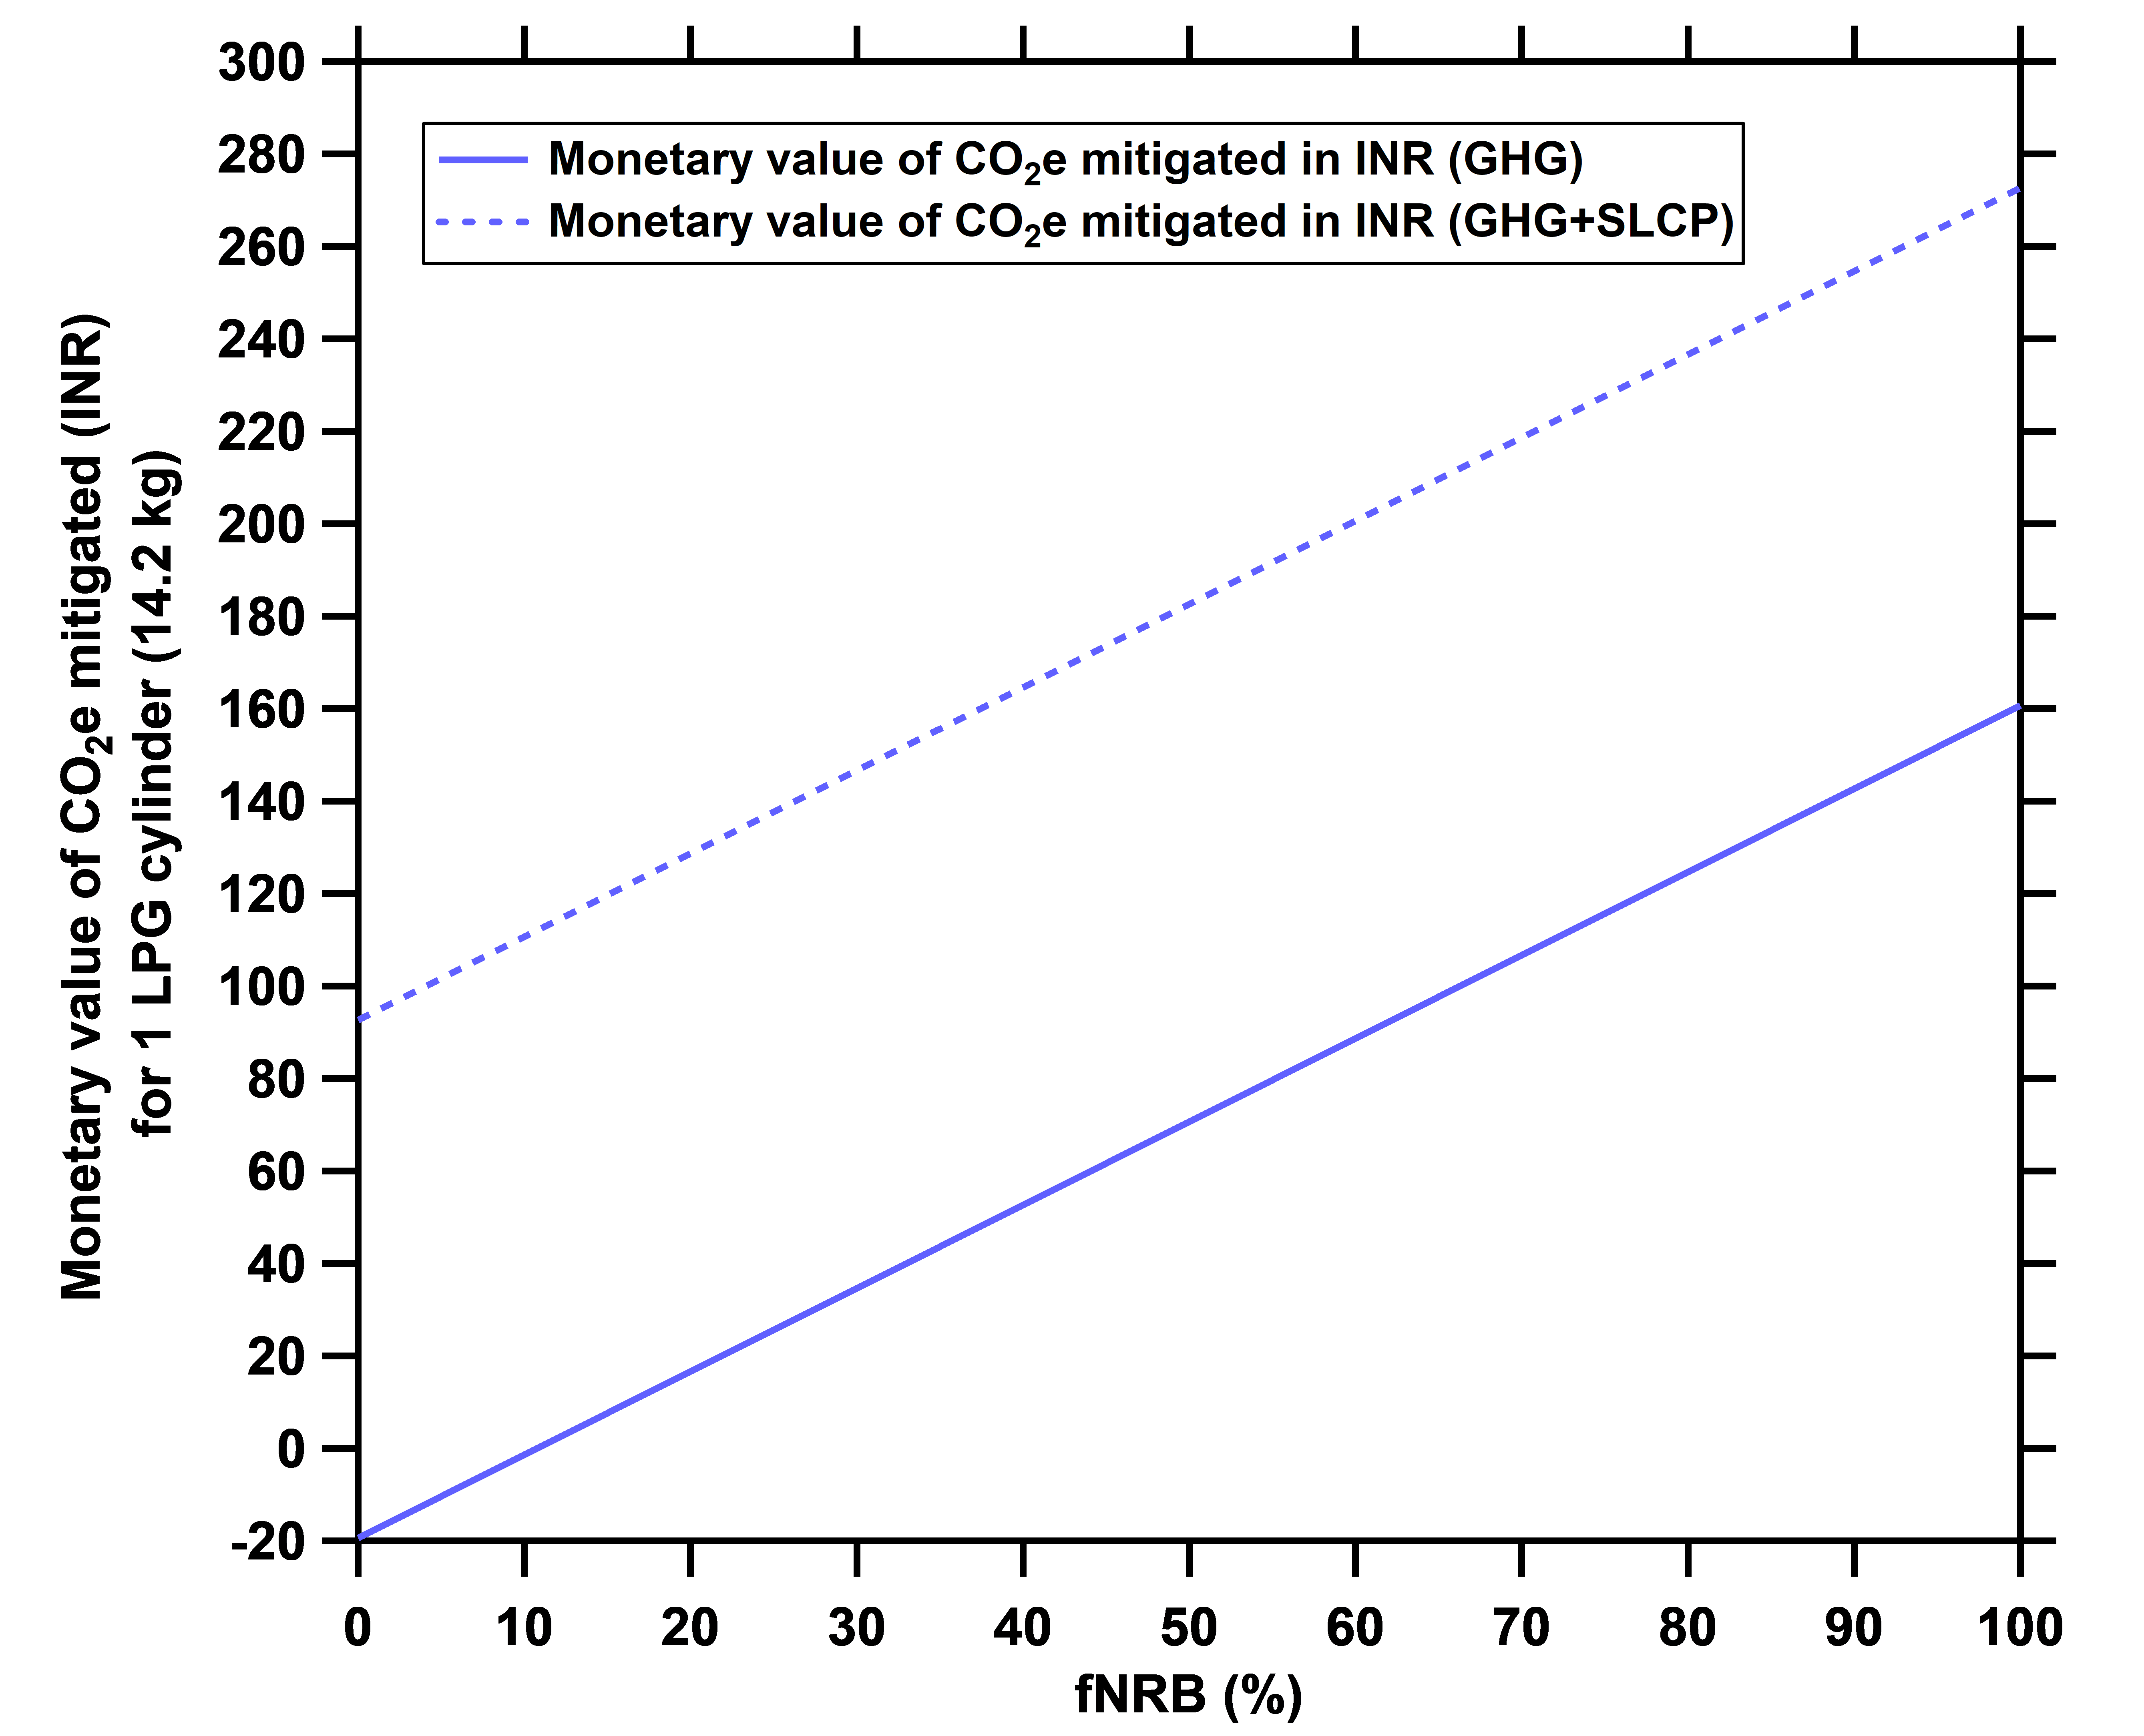
. 1-ton CO2e = 8.2 € (Fairtrade minimum pricing); 1 €= 90 INR is assumed.
Source: www.goldstandard.org/blog-item/carbon-pricing-what-carbon-credit-worth
Endnotes
[1]“Household Air Pollution Data,” accessed June 20, 2023, https://www.who.int/data/gho/data/themes/air-pollution/household-air-pollution.
[2] “National Family Health Survey (NFHS-5) 2019-21” (GoI, Ministry of Health and Family Welfare, 2021 2019), https://main.mohfw.gov.in/sites/default/files/NFHS-5_Phase-II_0.pdf.
[3] “Moving the Needle on Clean Cooking for All,” World Bank, January 19, 2023, https://projects.worldbank.org/en/results/2023/01/19/moving-the-needle-on-clean-cooking-for-all.
[4] “Household Air Pollution,” World Health Organization, November 28, 2022, https://www.who.int/news-room/fact-sheets/detail/household-air-pollution-and-health.
[5] S.K. Jindal, “Relationship of Household Air Pollution from Solid Fuel Combustion with Tuberculosis?,” The Indian Journal of Medical Research 140, no. 2 (August 2014): 167–70.
[6] Chen Chen and Sepideh Modrek, “Gendered Impact of Solid Fuel Use on Acute Respiratory Infections in Children in China,” BMC Public Health 18, no. 1 (December 2018): 1170, https://doi.org/10.1186/s12889-018-6035-z.
[7] ESMAP, “The State of Access to Modern Energy Cooking Services,” World Bank, July 15, 2020, https://documents.worldbank.org/en/publication/documents-reports/documentdetail/937141600195758792/The-State-of-Access-to-Modern-Energy-Cooking-Services
[8] Katherine Manchester and Jessica Vargas Escobedo, “The Energy Crisis No One Is Talking About: Cooking,” Clean Cooking Alliance, May 14, 2023, https://cleancooking.org/news/the-energy-crisis-no-one-is-talking-about-cooking/.
[9] “Clean Cooking,” Department of Economic and Social Affairs, United Nations, accessed April 3, 2023, https://sdgs.un.org/partnerships/clean-cooking.
[10] Iva Čukić et al., “Towards Sustainable Development Goal 7 ‘Universal Access to Clean Modern Energy’: National Strategy in Rwanda to Scale Clean Cooking with Bottled Gas,” Energies 14, no. 15 (July 28, 2021): 4582, https://doi.org/10.3390/en14154582; Hanung Budya and Muhammad Yasir Arofat, “Providing Cleaner Energy Access in Indonesia through the Megaproject of Kerosene Conversion to LPG,” Energy Policy 39, no. 12 (December 2011): 7575–86, https://doi.org/10.1016/j.enpol.2011.02.061.
[11] Carlos F. Gould and Johannes Urpelainen, “LPG as a Clean Cooking Fuel: Adoption, Use, and Impact in Rural India,” Energy Policy 122 (November 2018): 395–408, https://doi.org/10.1016/j.enpol.2018.07.042.
[12] “Scaling LPG for Cooking in Developing Markets,” Enea Consulting, September 23, 2019, https://www.enea-consulting.com/en/publication/scaling-lpg-for-cooking-in-developing-markets/.
[13] “86% of PMUY Beneficiaries Who Are Atleast One Year Old Returned for the Second Refill,” Press Information Bureau, accessed June 20, 2023, https://pib.gov.in/Pressreleaseshare.aspx?PRID=1576406.
[14] Abhishek Kar et al., “Using Sales Data to Assess Cooking Gas Adoption and the Impact of India’s Ujjwala Programme in Rural Karnataka,” Nature Energy 4, no. 9 (July 15, 2019): 806–14, https://doi.org/10.1038/s41560-019-0429-8; Sunil Mani, Shalu Agrawal, Abhishek Jain, and Karthik Ganesan, State of Clean Cooking Energy Access in India (New Delhi: CEEW, 2021), https://www.ceew.in/sites/default/files/ires-report-on-state-of-clean-cooking-energy-access-in-india.pdf; M Shardul et al., TERI. “Clean Fuel for Cooking Solutions.” Policy Brief Series, 0. The Energy and Resources Institute, February 2021https://www.teriin.org/sites/default/files/2021-02/clean-fuel-for-cooking-solutions-pb_0.pdf ; Bodie Cabiyo, Isha Ray, and David I Levine, “The Refill Gap: Clean Cooking Fuel Adoption in Rural India,” Environmental Research Letters 16, no. 1 (January 1, 2021): 014035, https://doi.org/10.1088/1748-9326/abd133; Rutuja Patil et al., “Barriers to and Facilitators of Uptake and Sustained Use of LPG through the PMUY in Tribal Communities of Pune District,” Energy for Sustainable Development 63 (August 2021): 1–6, https://doi.org/10.1016/j.esd.2021.04.008.
[15] Kirk R. Smith and Santosh Harish, “Ujjwala 2.0: From Access to Sustained Usage,” Collaborative Clean Air Policy Centre, August 6, 2019, https://ccapc.org.in/policy-briefs/2019/8/6/ujjwala-2-from-access-to-sustained-usage.
[16] Marc Jeuland et al., A Randomized Trial of Price Subsidies for Liquefied Petroleum Cooking Gas among Low-Income Households in Rural India (World Development Perspectives, 2023): 100490, https://doi.org/10.1016/j.wdp.2023.100490.
[17] At an exchange rate of 1 USD$ = INR 82.1807 and price of a 14.2kg domestic LPG refill of INR 1,103 as of March 31, 2023.
[18] Constantinos Vassiliades et al., “Policy Pathways for Mapping Clean Energy Access for Cooking in the Global South—A Case for Rural Communities,” Sustainability 14, no. 20 (October 20, 2022): 13577, https://doi.org/10.3390/su142013577.
[19] M Serrano-Medrano et al., “Promoting LPG, Clean Woodburning Cookstoves or Both? Climate Change Mitigation Implications of Integrated Household Energy Transition Scenarios in Rural Mexico,” Environmental Research Letters 13, no. 11 (November 13, 2018): 115004, https://doi.org/10.1088/1748-9326/aad5b8.
[20] Mikel González-Eguino, “Energy Poverty: An Overview,” Renewable and Sustainable Energy Reviews 47 (July 2015): 377–85, https://doi.org/10.1016/j.rser.2015.03.013.
[21] Emily Floess et al., “Scaling up Gas and Electric Cooking in Low- and Middle-Income Countries: Climate Threat or Mitigation Strategy with Co-Benefits?,” Environmental Research Letters 18, no. 3 (March 1, 2023): 034010, https://doi.org/10.1088/1748-9326/acb501
[22] Serrano-Medrano et al., “Promoting LPG, Clean Woodburning Cookstoves or Both?”; D Singh, S Pachauri, and H Zerriffi, “Environmental Payoffs of LPG Cooking in India,” Environmental Research Letters 12, no. 11 (November 1, 2017): 115003, https://doi.org/10.1088/1748-9326/aa909d; Chris Kypridemos et al., “Health and Climate Impacts of Scaling Adoption of Liquefied Petroleum Gas (LPG) for Clean Household Cooking in Cameroon: A Modeling Study,” Environmental Health Perspectives 128, no. 4 (April 2020): 047001, https://doi.org/10.1289/EHP4899.
[23]“G20 Bali Leaders’ Declaration,” November 15, 2022, https://www.g20.org/content/dam/gtwenty/gtwenty_new/about_g20/previous-summit-documents/2022-bali/G20%20Bali%20Leaders%27%20Declaration,%2015-16%20November%202022.pdf
[24] “The G20 And Clean Cooking: An Opportunity For Transformative Strides In Energy Access And Sustainable Development” (Global Alliance For Clean Cookstoves, n.d.), https://cleancooking.org/binary-data/RESOURCE/file/000/000/464-1.pdf.
[25] “G20 Energy Ministerial Meetings Wrap Up with Clean Cooking Front and Center,” Clean Cooking Alliance, July 15, 2016, https://cleancooking.org/news/07-15-2016-g20-energy-ministerial-meetings-wrap-up-with-clean-cooking-front-and-center/.
[26]“G20 Bali Leaders’ Declaration,” November 15, 2022, https://www.g20.org/content/dam/gtwenty/gtwenty_new/about_g20/previous-summit-documents/2022-bali/G20%20Bali%20Leaders%27%20Declaration,%2015-16%20November%202022.pdf
[27] Gold Standard Improved Cookstove Methodologies Guidebook (Gold Standard,2016), https://www.goldstandard.org/sites/default/files/documents/ics_methodology_guidebook_v1.pdf.
[28] Emily Floess et al., “Scaling up Gas and Electric Cooking in Low- and Middle-Income Countries: Climate Threat or Mitigation Strategy with Co-Benefits?,” Environmental Research Letters 18, no. 3 (March 1, 2023): 034010, https://doi.org/10.1088/1748-9326/acb501; Chris Kypridemos et al., “Health and Climate Impacts of Scaling Adoption of Liquefied Petroleum Gas (LPG) for Clean Household Cooking in Cameroon: A Modeling Study,” Environmental Health Perspectives 128, no. 4 (April 2020): 047001, https://doi.org/10.1289/EHP4899; ; M Serrano-Medrano et al., “Promoting LPG, Clean Woodburning Cookstoves or Both? Climate Change Mitigation Implications of Integrated Household Energy Transition Scenarios in Rural Mexico,” Environmental Research Letters 13, no. 11 (November 13, 2018): 115004, https://doi.org/10.1088/1748-9326/aad5b8.; D Singh, S Pachauri, and H Zerriffi, “Environmental Payoffs of LPG Cooking in India,” Environmental Research Letters 12, no. 11 (November 1, 2017): 115003, https://doi.org/10.1088/1748-9326/aa909d
