


Task Force 6: Accelerating SDGs: Exploring New Pathways to the 2030 Agenda.
Abstract
‘Offshore impacts’ are the environmental consequences of production and trade in places other than where these commodities are consumed. Consideration of such impacts in policy frameworks has emerged only recently. Frameworks to monitor overseas environmental impacts are critical to mitigating climate change and biodiversity loss but remain fragmented and underused. Key barriers relate to the coherence of these frameworks and governments’ capacity to facilitate their uptake. The G20, comprising the most significant trading nations, is in an unparalleled position to address these barriers through a small number of strategic interventions. This Policy Brief recommends that the G20 uses its influence to promote international awareness and uptake of existing frameworks and programmes, enhance data disclosure, build capacity in government organisations, and collaborate with other countries to develop and disseminate monitoring best practices.
1. The Challenge
Goal 12 of the United Nations Sustainable Development Goals (SDGs) seeks to promote “sustainable consumption patterns”. Yet, as the Sustainable Development Report 2022[1] demonstrates, achieving sustainable consumption requires taking into account offshore impacts of production and trade that occur in places other than where commodities are consumed. For many countries, such impacts vastly exceed the domestic consequences of consumption.
Unless countries take responsibility for their total environmental footprint, efforts to improve sustainability of domestic production are likely to be outweighed by, or could even exacerbate, degradation elsewhere. The concept aligns perfectly with the principles of responsible and sustainable consumption behaviours emphasised by the Lifestyle for Environment (LiFE) campaign, highlighted in the G20 theme of ‘One Earth, One Family, One Future’.
One striking example of offshore impacts of consumption is in trade of agricultural commodities. This trade is the mainstay of many economies, including developing nations, with about US$ 1.9 trillion of such commodities traded internationally in 2021.[2] Yet agricultural commodities are also one of the most significant drivers of environmental degradation globally. A recent study estimated that more than 90 percent of all deforestation in the tropics can be linked to agriculture.[3]
Offshore impacts have only recently been recognised in formal policy processes. Since the New York Declaration on Forests in 2014, voluntary commitments by companies and governments to reduce or eliminate deforestation have proliferated, although their effectiveness has been questioned.[4] More recently, there has been regulatory action, including in the EU,[5] the UK,[6] and the US,[7] which have mandated due diligence by companies that import commodities linked to deforestation.
To actively reduce offshore impacts, countries first need to understand them. Within the SDG framework, only one indicator explicitly attempts to capture them—i.e., the Material Footprint (MF). This quantifies the materials that underpin economic activity and indicates how efficiently they are being used to generate growth. However, MF offers only a crude proxy for environmental degradation and is inadequate for assessing the sustainability of resource use.
Target 16 of the post-2020 Biodiversity Framework formulated under the UN Convention on Biological Diversity (CBD), seeks to “reduce the global footprint of consumption in an equitable manner”.[8] The framework improves on consumption-based monitoring by incorporating four ‘component’ indicators. Besides the MF, two others provide important additional information on trade-linked impacts – the Ecological Footprint (EF)[9] and the Global Environmental Impacts of Consumption Indicator (GEIC).[10],[11] The EF considers holistically whether consumption-driven resource use is sustainable within the limits of the Earth’s bio-capacity, while the GEIC provides metrics to estimate the pressures on biodiversity, deforestation (and associated carbon emissions) and water resources associated with internationally traded agri-commodities (see Figure 1).
Figure 1: Location and Magnitude of India’s Tropical Deforestation Footprint According to the GEIC
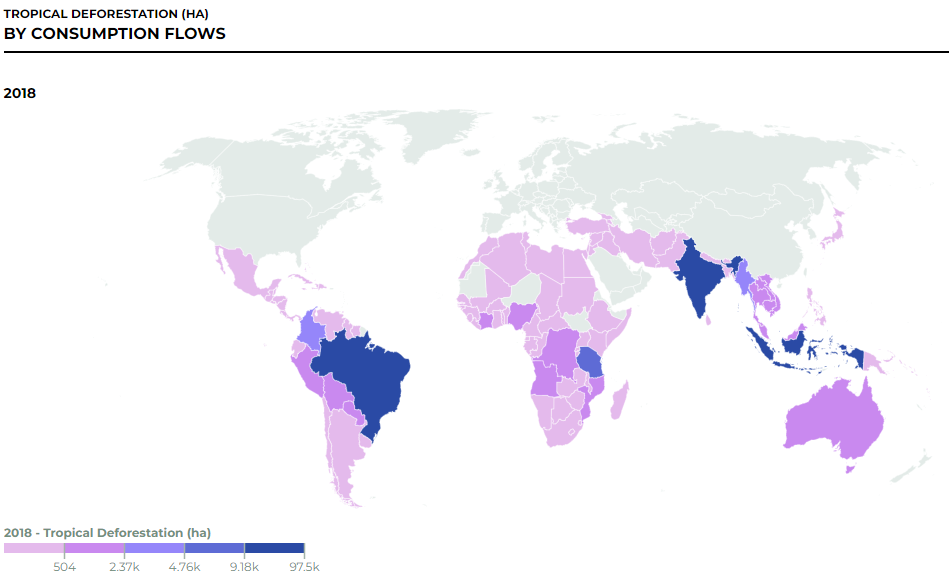
India’s economy is linked to 97,500 hectares of tropical deforestation in India itself and another 138,500 hectares overseas (mostly in Indonesia, which is mostly explained via a dependency palm oil – but also in Brazil, explained by demand for cattle and soybean). The offshore impacts of other G20 nations are proportionally far higher (See Appendix for additional footprint information for G20 nations).
Source: https://commodityfootprints.earth.[12]
In recent years, the science-base for understanding environmental impacts of commodity production and trade has grown significantly. Increased remote sensing information from satellites provides data on land-use change at high spatial and temporal resolution, which is accessible through software platforms such as the World Resources Institute’s Global Forest Watch.[13] Beyond creating new datasets, better uses of existing data have also been found. The Trase initiative[14] uses an array of existing data to map commodity supply chains and deforestation, linking importing countries and markets, and individual traders, to specific sourcing regions and localised impacts. Similar initiatives are emerging to map mining activities.[15] Alongside, there are moves to encourage greater disclosure and accountability from supply chain actors themselves, spearheaded by international non-government organisations (NGOs) within the Accountability Framework Initiative.[16]
Against this backdrop, two key challenges remain: increasing coherence across monitoring systems, and promoting uptake of information by policymakers and other practitioners.
There is urgent need for greater standardisation and alignment of the definitions used in monitoring, the types of data used for decision-making, and the ways data is collated and harmonised. Plenty of data in complex forms is available, but decision-makers lack the tools to absorb, interpret and act on it.
Without concerted action, policies to tackle the environmental impacts of consumption will continue to fall far short of related SDG and CBD commitments. Even so, a small number of straightforward interventions—which the G20 countries are in an excellent position to promote–could tip the balance towards more effective and actionable monitoring systems.
2. The G20’s Role
The G20 is in a prime position to address the offshore impacts of trade and consumption. First, G20 nations are active participants in—and beneficiaries of—the majority of commodity supply chains linked to key sustainability concerns, and have great political and diplomatic leverage to influence their governance. Second, statistical agencies in G20 countries provide most of the data that underpins monitoring efforts. Major corporations involved in international supply-chains are also primarily domiciled in G20 states, and are critical for providing data and taking action to make supply chains more sustainable. Third, G20 economies have substantial science budgets and world-leading research capacity; they have the expertise to fill data gaps and lead efforts to draw together disparate data, making it usable for decision-makers.
2.1 Coherence
To promote coherence across monitoring systems, the G20 should ensure that definitions of what is monitored are well defined, understood and agreed upon. If policies use definitions ill-matched to those used in monitoring, it could significantly hinder policy implementation, because the efficacy of a policy depends on information that aligns with its scope and objective. For example, in ‘due diligence’ legislation that several countries, as well as the EU, have either adopted or are discussing, the UN Food and Agriculture Organization’s (FAO) definition of ‘forests’ is used to ensure alignment with international conventions and reporting processes. However, within the scientific community, the remote-sensing products currently available to monitor ‘forest loss’ do not readily align with this definition.
Monitoring biodiversity is even more complex: no single, holistic measure exists, given its multifaceted nature, yet hundreds of biodiversity-related indicators, tools and methods have been developed with little standardisation around uptake. Many initiatives also focus on aligning sustainability metrics and evaluation frameworks, including the Science Based Targets Network[17] and the Task Force on Nature Related Financial Disclosure.[18] Because these initiatives have many contributors from G20 nations, the G20 is in a strong position to endorse them and drive greater uptake.
There are also opportunities for statistical agencies to enhance existing datasets to make them more useful. Most international trade-based assessments use a combination of FAO and UN Comtrade databases, or derivations thereof. Yet the classification schemes used in these datasets are often not granular enough to effectively allocate the impacts (positive or negative) of production or processing activities to downstream consumption. The reporting codes used to classify materials need to be disaggregated so that customs agencies can provide more granular data.
Customs agencies also need to disclose more of the information that they collect, such as the trade volumes associated with named importing or exporting entities—details often protected by competition law. Greater disclosure would lead to greater transparency in international trade, enabling governments and third parties to better assess compliance with trade-linked environmental regulations and progress against broader sustainable consumption targets.
Further, where no national statistical records on production and trade of agricultural materials can be obtained, the FAO often estimates data based on unofficial sources, which reduces confidence in its results.[19] Initiatives to improve data collection require further promotion and support. National statistics agencies and others that collect data, such as the FAO, need enough funding to ensure that commonly relied on datasets are as robust as possible.
It is challenging to promote coherence in a landscape where ownership of data is scattered across public and private institutions and is often not transparent enough.[20] In the UK, the Global Resource Initiative[21] highlighted the need for coherent monitoring that would allow policymakers to pinpoint areas of highest environmental concern, before more granular assessments ascertain whether supply chain activities are concretely linked to environmental harm. Importantly, the provision of company-specific information in production landscapes, and other fine-scale evidence, would enable assessment of how far policies have meaningful real-world impact on practice. Figure 2 conceptualises such a monitoring framework. Platforms such as the Accountability Framework Initiative,[22] the Forest, Agriculture and Commodity Trade (FACT) Dialogue[23] (co-chaired by the UK and Indonesia), the Forest Data Partnership[24] (co-chaired by the FAO and the World Resources Institute (WRI)) and the Consumer Goods Forum Forest Positive Coalition[25] are established forums for discussions on data collection and alignment.
Figure 2: A Model for the Holistic Assessment of Risk, Impacts and Response in Supply-Chain Systems

Source: Adapted from the UK Global Resource Initiative.[26]
2.2 Uptake
Currently, in policymaking, uptake of data lags a long way behind policy commitments. According to a recent Organisation for Economic Co-operation and Development (OECD) report,[27] despite growing recognition of the role of trade in environmental impacts, only 40 percent of regional trade agreements covering goods and services contain provisions on the environment. Sweden[28] and the UK[29] recently started incorporating consumption-based environmental accounts into their national statistics, but these efforts remain experimental. Although linked to policy commitments such as the Swedish Generational Goal and the UK’s 25-year Environment Plan, respectively, they are far from embedded across domestic policy processes.
It may take time to incorporate newer data and methods into policymaking. However, a fundamental challenge is the complexity of available data (such as assumptions incorporated in modelled assessments, or the sheer volume of data or metrics available), which makes it difficult for policymakers to absorb and use it. Large private corporations may have dedicated science teams able to digest and analyse vast quantities of information, but this is often a ‘closed-source’, unavailable to policymakers. As a group of the world´s leading developed economies, it is incumbent on the G20 to build government capacity to understand the challenges associated with consumption, and to adequately accommodate related data within policy. It should also be a priority to share good practices across G20 members and beyond, to spread the burden and build mutual understanding of the challenges.
The G20 can also provide much needed resources for sharing lessons between lower- and higher-income countries on how best to collate, align, and fill gaps in data. The environmental impacts of agricultural production are often most acute in lower-income regions, so any such investment will also result in improved monitoring outcomes for the G20 states themselves.
3. Recommendations to the G20
It is vital to minimise the negative offshore environmental impacts of consumption and trade, and to promote trade as an enabler of sustainable development. Monitoring plays a key role. The following are suggestions on how the G20 can improve monitoring systems and promote their uptake:
- Establish a Working Group dedicated to international monitoring of offshore impacts. This would build on recommendations of the G20 Resource Efficiency Dialogue, which has been supported at a high political level. Such a group would promote shared priorities for assessing sustainability risks linked to commodity trade, including biodiversity loss, deforestation, land degradation and impacts on vulnerable actors. The group should aim at aligning key definitions and methods in a manner that promotes inclusion and legitimacy, and help to embed information on consumption and material flows, and information disclosed by industry, into national and G20-scale monitoring systems (see Figure 2). The group can draw on expertise from established programmes and the scientific community from across G20 nations, and connect to existing G20 Working Groups (e.g. the one on Environment and Climate Sustainability, and on Trade and Investment).
- Motivate statistics agencies, government departments and the private sector to improve data disclosure. It should be a priority to improve existing data systems, such as the UN Comtrade and FAO systems, especially to disaggregate classification schemes. Efforts should be made to publicly release more detailed information on companies involved in trade that have been already captured, for example, in customs records. Voluntary, and where appropriate mandatory, mechanisms for corporate disclosure would allow fine-scale assessment of threats and solutions in production landscapes. Such mechanisms can be built on existing platforms and initiatives (e.g. the Consumer Goods Forum’s (CGF) Forest Positive Coalition). There should be investment in the data-science solutions needed to make new and existing datasets interoperable, as part of a more coherent monitoring system.
- Build capacity in G20 nations’ civil services, statistics agencies, competent authorities, and in industry. Government capacity to use information on offshore impacts is currently low. Capacity building is required to ensure existing and new data is used to its full potential, and to effectively support existing voluntary and regulatory compliance systems. This includes working with leaders in the private sector to understand best practices. Where private sector capacity is low (e.g. in particular sectors or regions, or in small and medium sized enterprises) there is a need for technology and knowledge transfer to enhance monitoring. The potential for legal mechanisms to promote data sharing and overcome gaps in transparency should be explored.
- Work with other nations to share lessons learned and best practices in monitoring. The G20 has significant political and diplomatic leverage, as well as highly advanced data science and statistics collection systems. It should use these to share monitoring best practices and lessons learned – be it within the G20, or from its trade partners and science base. As a priority, it needs to exchange knowledge with lower-income countries to ensure their economic development does not cause offshore impacts the way the G20 nations’ development did. This means providing them technical and financial resources to strengthen capacity, including their ability to effectively engage with trading partners.
Attribution: Chris West et al., “Monitoring Offshore Environmental Impacts of Trade,” T20 Policy Brief, June 2023.
Appendix
G20 countries (including individual members of the EU), their domestic and overseas tropical and subtropical deforestation footprints in 2018 are shown in Table A1, sourced from the GEIC Indicator10. The last column gives the estimated date in 2023 on which each country’s consumption leads it to ‘overshoot’ its fair share of the world’s available bio-capacity; derived from the Ecological Footprint.[30] Countries are listed in alphabetical order. The last column says ‘none’ if the country does not have an overshoot day because its consumption is below the global fair share. Columns say ‘not obtainable’ when a country’s consumption is not currently covered by the GEIC Indicator.
Table A1
| Country | Domestic tropical and subtropical deforestation footprint, 2018
(hectares) |
Overseas tropical and subtropical deforestation footprint, 2018
(hectares) |
Total tropical and subtropical deforestation footprint, hectares (2018) | Date on which country’s consumption will exceed a fair share of available bio-capacity (2023) |
| Argentina | Not obtainable | Not obtainable | Not obtainable | 24 June |
| Australia | 86,530 | 19,199 | 105,729 | 23 March |
| Austria | 0 | 4,020 | 4,020 | 6 April |
| Belgium | 0 | 18,209 | 18,209 | 26 March |
| Brazil | 1,231,754 | 20,646 | 1,252,401 | 12 August |
| Bulgaria | 0 | 1,102 | 1,102 | 9 June |
| Canada | 0 | 17,796 | 17,796 | 13 March |
| China | 0 | 463,646 | 463,646 | 2 June |
| Croatia | 0 | 696 | 696 | 29 May |
| Cyprus | 91 | 293 | 384 | 31 May |
| Czech Republic | 0 | 2,474 | 2,474 | 12 April |
| Denmark | 0 | 3,938 | 3,938 | 28 March |
| Estonia | 0 | 1,171 | 1,171 | 14 March |
| Finland | 0 | 2,597 | 2,597 | 31 March |
| France | 0 | 50,091 | 50,091 | 5 May |
| Germany | 0 | 57,792 | 57,792 | 4 May |
| Greece | 0 | 4,148 | 4,148 | 21 May |
| Hungary | 0 | 2,093 | 2,093 | 30 May |
| India | 97,495 | 138,110 | 235,605 | None |
| Indonesia | 420,097 | 20,330 | 440,427 | 3 Dec |
| Ireland | 0 | 4,507 | 4,507 | 21 April |
| Italy | 0 | 41,453 | 41,453 | 15 May |
| Japan | 2,756 | 66,152 | 68,908 | 6 May |
| Latvia | 0 | 607 | 607 | 1 April |
| Lithuania | 0 | 750 | 750 | 7 April |
| Luxembourg | 0 | 2,451 | 2,451 | 14 February |
| Malta | 0 | 284 | 284 | 16 April |
| Mexico | 2,4159 | 14,323 | 38,482 | 31 August |
| Netherlands | 0 | 21,851 | 21,851 | 12 April |
| Poland | 0 | 8,930 | 8,930 | 2 May |
| Portugal | 0 | 5,502 | 5,502 | 7 May |
| Republic of Korea | 0 | 38,604 | 38,604 | 2 April |
| Romania | 0 | 2,645 | 2,645 | 11 June |
| Russia | 0 | 29,456 | 29,456 | 19 April |
| Saudi Arabia | Not obtainable | Not obtainable | Not obtainable | 27 April |
| Slovakia | 0 | 1,092 | 1,0912 | 3 May |
| Slovenia | 0 | 1,108 | 1,108 | 18 April |
| South Africa | 24,867 | 10,865 | 35,731 | 1 June |
| Spain | 0 | 40,123 | 40,123 | 12 May |
| Sweden | 0 | 5,674 | 5,674 | 3 April |
| Türkiye | 21,029 | 16,158 | 37,187 | 22 June |
| United Kingdom | 0 | 35,977 | 35,977 | 19 May |
| United States of America | 0 | 217,244 | 217,244 | 13 March |
Endnotes
[1] Jeffrey D. Sachs et al., Sustainable Development Report 2022. (2022). https://dashboards.sdgindex.org/
[2] FAO, “FAOSTAT.” https://www.fao.org/faostat/en/
[3] Pendrill et al., “Disentangling the Numbers behind Agriculture-Driven Tropical Deforestation.” Science 311, no. 6611 (2022). DOI: 10.1126/science.abm9267
[4] NYDF Assessment Partners, “Protecting and Restoring Forests: A Story of Large Commitments yet Limited Progress. New York Declaration on Forests Five-Year Assessment Report.” (2019). https://climatefocus.com/publications/nydf-2019-progress-report-protecting-and-restoring-forests/
[5] Council of the European Union, “Proposal for a Regulation of the European Parliament and of the Council on the Making Available on the Union Market as Well as Export from the Union of Certain Commodities and Products Associated with Deforestation and Forest Degradation and Repealing Regulation (EU) No 995/2010.”
[6] HM Government, “UK Environment Act 2021 SCHEDULE 17 Use of Forest Risk Commodities in Commercial Activity.” https://www.legislation.gov.uk/ukpga/2021/30/schedule/17/enacted
[7] US Congress, “S.2950 – FOREST Act of 2021.” https://www.congress.gov/bill/117th-congress/senate-bill/2950
[8] Convention on Biological Diversity, “Nations Adopt Four Goals, 23 Targets for 2030
In Landmark UN Biodiversity Agreement”. https://prod.drupal.www.infra.cbd.int/sites/default/files/2022-12/221219-CBD-PressRelease-COP15-Final_0.pdf
[9] Mathis Wackernagel and William E. Rees, “Our Ecological Footprint: Reducing Human Impact on the Earth”. (Philadelphia: New Society Publishers, 1998)
[10] Croft et al., “Technical Documentation for an Experimental Statistic Estimating the Global Environmental Impacts of Consumption: 2022 Version.” ISSN 0963-9091. (Peterborough, UK, 2022). https://hub.jncc.gov.uk/assets/7a4063c9-a221-4ca1-ab6a-3b2fae544b32
[11] Aside from the Material Footprint, the ‘Food Waste Index’ constitutes the fourth component indicator adopted under Target 16, but this indicator does not relate to trade-related impact assessment.
[12] Commodity Footprints, “Commodity Footprints.” https://commodityfootprints.earth/
[13] WRI, “Global Forest Watch.” https://www.wri.org/initiatives/global-forest-watch
[14] Trase, “Trase.” https://www.trase.earth/
[15] Victor Maus et al., “An Update on Global Mining Land Use.” Scientific Data 9, no. 433 (2022). https://doi-org.ezp.sub.su.se/10.1038/s41597-022-01547-4
[16] Accountability Framework Initiative, “Accountability Framework Homepage.” https://accountability-framework.org/
[17] SBTN, “Science Based Targets Network.” https://sciencebasedtargetsnetwork.org/
[18] TNFD, “TNFD – Taskforce on Nature-Related Financial Disclosures.” https://tnfd.global/
[19] FAO, “Statistical Standard Series: Imputation”, 2019. https://www.fao.org/3/cb9339en/cb9339en.pdf
[20] Toby Gardner et al., “Transparency and Sustainability in Global Commodity Supply Chains.” World Development, 121 (2019), 163-177, https://doi.org/10.1016/j.worlddev.2018.05.025.
[21] UK GRI, “Global Resource Initiative Final Recommendations Report.” https://www.gov.uk/government/publications/global-resource-initiative-taskforce
[22] Accountability Framework Initiative, “Accountability Framework Homepage.”
[23] FACT Dialogue, “FACT Dialogue.” https://www.factdialogue.org/.
[24] Forest Data Partnership, “Forest Data Partnership.” https://www.forestdatapartnership.org
[25] Consumer Goods Forum, “Forest Positive Coalition – Create a Forest Positive Future for the Planet.” https://www.theconsumergoodsforum.com/environmental-sustainability/forest-positive/
[26] UK GRI, “Global Resource Initiative Final Recommendations Report.”
[27] Christophe Bellmann and Alena Bulatnikova. Incorporating Environmental Provisions in Regional Trade Agreements in Chapters and Articles Dealing with Trade in Services. (Paris: OECD, 2022). https://doi.org/10.1787/6e976798-en
[28] Statistics Sweden, “Greenhouse Gas Emissions from Swedish Consumption Decreased in 2020.”
[29] Defra, “17: Global Biodiversity Impacts of UK Consumption.” (2023) https://www.gov.uk/government/statistics/england-biodiversity-indicators/17-global-biodiversity-impacts-of-uk-consumption
[30] Earth Overshoot Day, “Country Overshoot Days 2023.” https://www.overshootday.org/newsroom/country-overshoot-days/

