


Task Force 1: Macroeconomics, Trade, and Livelihoods: Policy Coherence and International Coordination.
Ensuring and managing the fiscal space is necessary for sustained government investment in human capital. As human capital complements physical capital in the ‘production’ of GDP, countries that can raise adequate resources for such investments experience higher growth in the long run. This policy brief explores the relationship between fiscal space and investment in the health sector. It also looks at the institutional determinants of fiscal space in the G20 countries during 2005-2021, and establishes that country-specific institutions determine the evolution of the budgetary space. Compared to ‘normal’ years, the positive effects of institutions are more pronounced during crisis years (in our sample, 2009 and 2020). However, the institutions affect different countries differently. The G20 countries vary widely in terms of their historical experience, economic environment, and institutional realities, thus representing a microcosm of the world. As a result, the policy lessons are scalable at a global level.
1. The Challenge
Ensuring fiscal space for critical social sector investments is necessary to achieve universal health coverage (UHC). Fiscal space—or the ‘capacity of the national government to mobilize additional budgetary resources for public purposes without impacting its financial sustainability’—plays an essential role in developing sustainable health financing policies for the overall development of health systems (Behera, D.K et al 2022) Studies have identified low fiscal space as one of the key reasons for low investment in and the poor performance of health systems. Public financing is critical to achieving UHC and having a higher fiscal space for health (Tandon, 2018). This would also mean raising budgetary resources for health or budget prioritisation, improved health spending efficiency, reprioritising expenditure, and mobilising external resources for the health sector.
The importance of fiscal space in the health sector was highlighted during the COVID-19 pandemic, which also resulted in a global economic crisis with severe consequences for financing health and sustaining progress toward UHC. The pandemic triggered exogenous shocks to the national economy, slowing economic activity, unemployment, and budgets. The crisis led to a larger contraction in global GDP 24 percent overall in 2020 (United Nations, 2020). The crisis also led to a significant deterioration in public finances and a tightening of the budget due to limited fiscal space, which usually affects core health system functions and activities (Macroeconomic Policy and Financing for Development Division, 2020). Containment measures, increased government spending, and lower tax revenues have increased budget deficits and government debt, which, as a percentage of GDP, has reached its highest levels over the past several decades.
Figure 1: Annual growth rate in Per capita GDP, 2000-2027
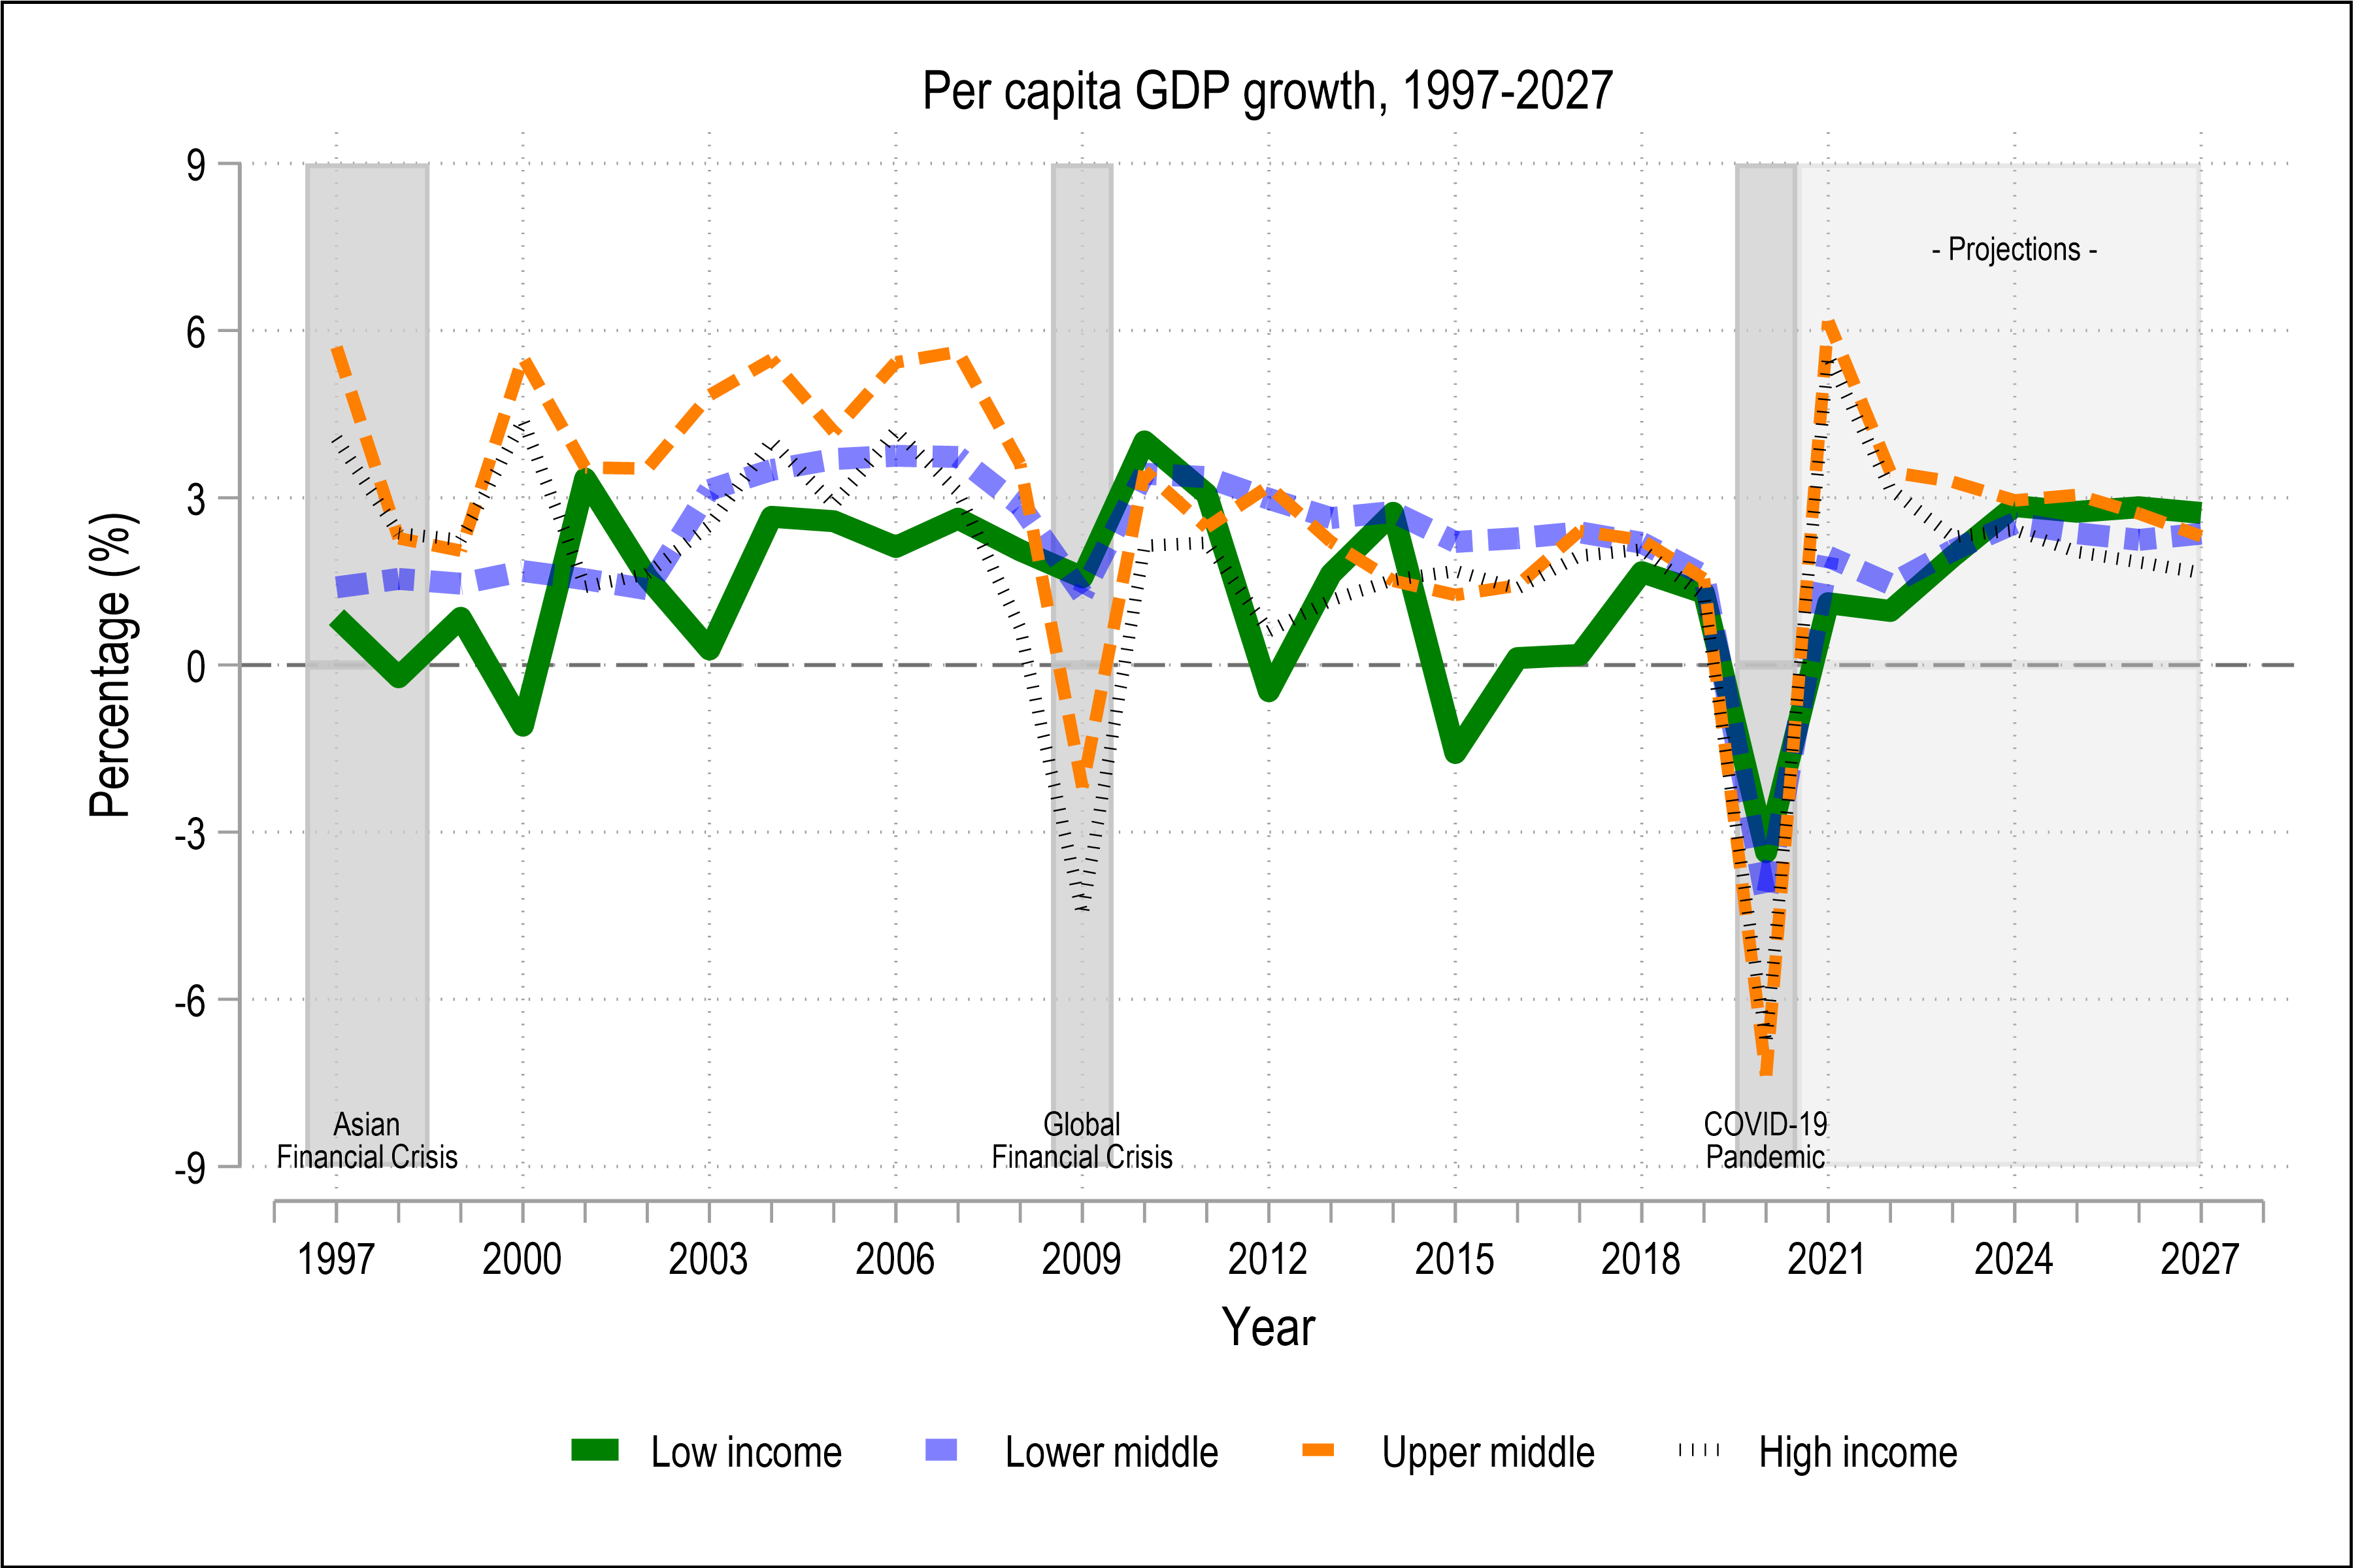
Source: World Bank, 2022
Literature also highlights those countries that entered the crisis with limited fiscal space and relied on smaller fiscal support packages, at the risk of delaying the recovery (Macroeconomic Policy and Financing for Development Division, 2020; Tandon, 2021). The pandemic has considerably increased the government debt burden over the medium term, potentially limiting resources for development purposes. The COVID-19 crisis also precipitated significant differences in fiscal space and borrowing costs. The G20 countries saw more than US$7 trillion in crisis-related above-the-line fiscal support (such as revenue and spending measures) and US$5 trillion in below-the-line support for tackling the crisis (IMF, 2021). The G20 countries pooled US$1.2 billion into the health sector, with the US accounting for US$687 billion (see Annexures 1 and 2 for details of the fiscal measures adopted by the G20 countries; OECD, 2021). An analysis of the G20 countries’ fiscal measures shows that additional public investment in the health sector was spent on COVID-19 and non-COVID-19 health service delivery, purchasing healthcare services, augmenting health infrastructure, and recruiting human health resources to tackle the pandemic challenge (Tomas et. Al., 2020). Many countries allocated additional funding by reallocating the national and subnational budgets, drawing from reserve funds, or temporarily loosening fiscal rules (Thomas et al.,2020; Thomson et al, 2022).
Crisis and fiscal space
The magnitude and composition of fiscal measures during the COVID-19 crisis provide an opportunity to G20 countries to rethink their approach to improving investment in health systems and achieving UHC. The experience of G20 countries shows that well-funded health systems are better placed to absorb unexpected costs and mobilize additional resources in a crisis. Drawing on financial reserves and undertaking public borrowing helps countries meet evolving and unpredictable spending needs. This merits a relook at financial institutions, both nationally and globally, that can absorb shock and make the economy more resilient. A resilient economy not only helps meet the goals at a national level but also helps strengthen household capacity to deal with exogenous shocks created due to various conditions such as economic crises, health shocks, and natural disasters (Thomas et al., 2020; Thomson et al., 2022). This has been proved through the human capital model, which states that market behaviour, which is an input to national GDP, is an outcome of consumption or investment at an individual level (Grossman, 1999). The G20 nations have a vital role in restructuring financial institutions. Strengthening financial institutions—which includes banking, philanthropy, or donor assistance programmes led through multilateral and bilateral agencies—is the need of the hour. During a crisis, the interplay between declining economic activity and countercyclical fiscal and monetary policies will eventually determine levels of government spending across countries (Tandon, 2020). The linkages between banking and strong institutional frameworks will significantly improve fiscal space and cover financial gaps. Understanding how banking and other institutions operate will directly affect the government’s public spending.
Given the importance of fiscal space, the policies that are relevant to the G20 countries at the micro level and that they adopt are easily scalable globally.
G20 countries’ experiences (2005-2021)
The three traditional measures of fiscal space in an economy are: government debt as a percentage of GDP (cumulative government debt); primary balance (revenue net of expenditure) as a percentage of GDP; and fiscal balance (revenue net of expenditure including interest servicing) as a percentage of GDP (Kose et al., 2022). We have plotted the trajectories of these variables in Figure 2.
Figure 2: Trajectories of Average Government Debt, Primary Balance, and Fiscal Balance (2005-2021)

Source: Authors’ calculation based on cross country data (Kose et al., 2022).
Data reveals that 2009 and 2020 are the crisis years; and 2009 onwards, the G20 group consistently experienced a negative primary balance.[a] This is even more pronounced in Figure 3.
Figure 3: Average Primary Balance: Time Series
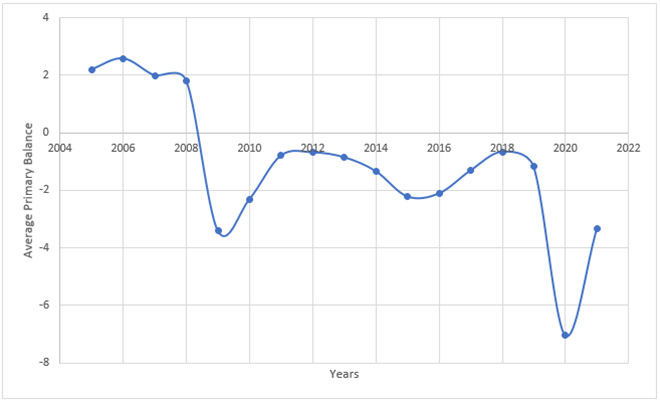
Source: Authors’ calculation based on cross country data (Kose et al., 2022).
Over the years, the country-wise experiences also differ (see Table 1).
Table 1: Country-wise Trend (2005-2021)
| Country | Mean |
| Argentina | -1.31 |
| Australia | -2.29 |
| Brazil | .35 |
| Canada | -1.12 |
| China | -1.88 |
| France | -2.38 |
| Germany | 0.70 |
| India | -3.12 |
| Indonesia | -0.26 |
| Italy | 0.46 |
| Japan | -4.67 |
| South Korea | .77 |
| Mexico | .20 |
| Russia | 0.838 |
| Saudi Arabia | 1.79 |
| South Africa | -0.66 |
| Turkey | 0.18 |
| UK | -3.83 |
| US | -4.61 |
Source: Authors’ calculation based on cross country data from Kose et al., 2022).
Barring seven countries (Brazil, Germany, Italy, Korea, Saudi Arabia, Russia, and Turkey), the primary balance is, on average, negative for the rest (see highlighted countries). We rank countries from better to worse in Figure 4, depending on their performance.
Figure 4: Relative Position of Countries
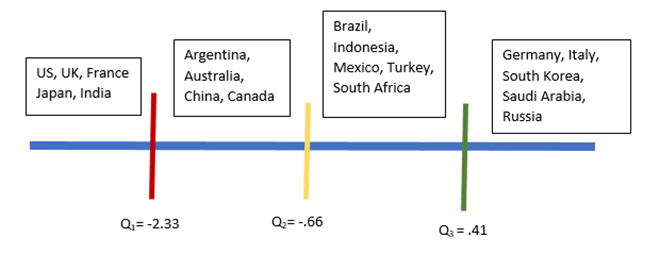
Note: The numbers refer to quartiles.
The only surprise inclusion in the highest deficit category is India. As expected, the performances are diverse.
2. The G20’s Role
While we wish to identify a unified role for the G20 countries in preserving the fiscal space, their experiences vary across time. As such, identifying common factors will help elucidate the role of the G20 counties.
Following Bodea and Higashijima (2017) and Garigga and Rodrequez (2023), we contend that two institutions that primarily shape the state of fiscal balance are central bank independence and democracy.
As the defender of the domestic currency’s external and internal values, independent central banks prefer a non-deficit budget. They would discourage excessive government borrowing through appropriate interest rate policy. Central bank independence implies a country’s monetary policy is not accommodating to government whims, and hence it provides a check and balance on excessive spending.
This policy brief does not interpret a democracy merely in terms of majority rule. In our understanding, democracy is a system of governance where the elected legislature, judiciary, and executive strengthen and impose mutual checks and balances on each other. We contend that the restraints extend to economic variables such as fiscal space.
But there is a caveat. In an imperfect democracy without the necessary checks and balances, interest groups may exacerbate the pressure on public funds and reduce the fiscal pool. There may be a democracy without sufficient central bank independence. On the other hand, banking independence, if it operates under strategic government, will be ineffective (as highlighted in our subsequent analysis).
Considering this caveat, the following can be understood as the major determinants of fiscal space:
Table 2: Major Determinants of Fiscal Space
| Proposed Determinant | Reason |
| Past values of fiscal space indicator (PBY: primary balance as % of GDP)) | If fiscal space in the past is high/low, current space may follow suit due to hysteresis |
| GDP per capita (world development indicator) | May allow a country to create more fiscal space |
| Years | Periods of global shock |
| Banking independence (Garriga, 2016)[b] | Central bank independence increases fiscal space |
| Democratic institutions (Centre for Systemic Peace)[c] | Institutions matter in creating fiscal space through checks and balances. |
To isolate the precise effects of institutional variables on fiscal space, we take recourse of a regression analysis. To extract higher leverage from the data, we now recognise that the G20 countries differ significantly. Thus, we run the regression with the country groups: low- and middle-income countries (n=9) and high-income countries (n=10).[d] Table 3A refers to the experience of low- and middle-income countries.
Table 3A: Experiences of Low- and Middle-Income Countries
| Determinants | Effect | Comments |
| 1 Unit increase in Past (PBY: primary balance as % of GDP)) | Increases pby by .65 units (***) | Convergence |
| 1 Unit increased in past GDP per capita | – | Not Significant |
| 2009 | – | 2009 crisis did not affect much |
| – | Banking Independence ineffective in 2009 | |
| – | Democracy Score ineffective in 2009 | |
| 2020 | Compared to other years, pby went down by 8.2% (***) | Crisis Year |
| Compared to other countries, in countries with higher banking independence score, pby went down by 4.58% | Effect of Banking Independence in 2020 is significant | |
| Compared to other countries, in countries with higher democracy score, pby went down by 8.3 % (***) | Slight deterioration in pby in countries with higher democracy score | |
| 1 unit increase in Democracy Score | – | Not significant Overall |
| – | Not Significant in 2009 or 2020 Crisis or | |
| 1 Unit Increase in Banking Independence Score | — | Not significant during 2009 Crisis |
| Increase pby by 6.29% during 2020 Crisis (***) | Has a positive effect during 2020 crisis. |
Source: Authors’ Calculation
Now, we consider the high GDP per capita countries (see Table 3B)
Table 3B: High-Income Countries
| Determinants | Effect | Comments |
| 1 Unit increase in Past PBY | Increases pby by .78 units (***) | Convergence is slower compared to poor and low income countries. |
| 1 Unit increased in Past GDP per capita | – | Not Significant |
| Year 2009 | Compared to other years, pby went down by 29.32% | Crisis Year |
| Compared to other countries, pby went down by 29.37% in countries with higher banking independence | Banking Independence ineffective in 2009 | |
| Compared to other countries, pby went down by 6.71% in countries with higher democracy score (**) | Positive effect on Fiscal space during 2009 crisis. | |
| Year 2020 | Compared to other years, pby went down by 10%% (***) | Crisis Year |
| Compared to other countries, in countries with higher banking independence score, pby went down by 11% (**)) | Banking Independence made things worse | |
| Compared to other countries, in countries with higher democracy score, pby went down by 6.58 (**) | Positive effect on Fiscal space during 2020 crisis | |
| 1 unit increase in Democracy Score | Increases pby by 28.75% overall (***) | Significant Effect |
| Increases pby by 24.74% during 2009 Crisis (***) | Important in 2009 Crisis | |
| No Significant Effect During 2020 Crisis | ___ | |
| 1 Unit Increase in Banking Independence Score | — | Not significant during 2009 Crisis, 2020 crisis or overall |
Source: Authors’ Calculation
Thus, different institutions have marked differences in roles across rich and emerging countries. Their experiences can be summarised as:
- Convergence rate is low in rich countries: past debt lingers for shorter period in poor and low-income countries.
- Rich countries’ fiscal space decreased sharply during the 2009 crisis than the 2020 crisis.
- In low- and middle-income countries, banking independence contributed positively to containing the 2020 crisis.
- Democracy has a more positive impact for rich countries.
Across both sets of countries, GDP per capita does not determine the extent of primary balance. However, we contend that GDP per capita plays an indirect role. Data reveals that richer countries can sustain higher debt. The ‘market’ believes that this group can service future debt with relative ease. This is also evident in the correlation between five-year sovereign debt spread and GDP per capita (see Table 4). A high spread implies more risk and vice versa.
Table 4
| Low and Middle Income | High Income |
| .37(***) | -.4 (**) |
Source: Authors’ Calculation
In other words, the higher the income, the lower the risk and the higher the market confidence. As a result, these countries can borrow and generate enough fiscal space for themselves.
3. Recommendation to the G20
The role of the G20 countries (for the wider world) and the recommendations to the G20 countries (in a micro sense) cannot be totally distinguished. As such, the G20 countries can:
- Encourage other countries to adopt stringent banking norms (Basel III norms).
- Make trade and other bilateral relations (such as overseas aid) contingent on countries’ promoting good governance.
- Adopt a flexible framework to trade policy (and foreign policy in wider sense) to keep in mind partner countries social, economic, and institutional realities.
- Encourage South-South agreements as these countries have similar development trajectories.
Additionally, the G20 countries can consider the following strategies to preserve fiscal space:
- Democracy and central bank independence indicators are effective in inculcating good governance principles during the crisis years. They act as automatic stabilisers of fiscal space.
- In the short and medium run, strengthen central bank independence and democratic institutions, such as independent judiciary and executive, ensure press freedom, and give adequate space to minority voices.
- In the long run, promote economic growth through market-friendly policies, while keeping the broad goal of redistribution and equality of opportunity in mind.
- Responsive regulation is important for market development and the creation of institutional structures that affect a country’s economic stability, which defines government expenditure on social policies and its sustainability.
Attribution: Bodhisattva Sengupta et al., “Institutions, Fiscal Space, and Social Health Protection,” T20 Policy Brief, June 2023.
References
Behera, Deepak Kumar, Umakant Dash and Santosh Kumar Sahu, “Exploring the possible sources of fiscal space for health in India: insights from political regimes”. Health Research Policy and Systems, 20, no 32 (2022), available at https://doi.org/10.1186/s12961-022-00831-4
Bodega, Christina and Masaaki Higashijima, “Central Bank Independence and Fiscal Policy”, British Journal of Political Science, 47, no 2 (2017): 47-70
Garriga, Ana Carolina, “Central bank independence in the world: A new data set.” International Interactions 42, no. 5 (2016): 849-868
Garriga, Ana Carolina and Cesar M Rodriguez, “Central bank independence and inflation volatility in developing countries”, Economic Analysis and Policy 78, (2023): 1320-1341
Grossman, Michael, “The Human Capital Model of the Demand for Health”, Working Paper No 7078, National Bureau of Economic Research, (1999), https://www.nber.org/papers/w7078
“G-20 Surveillance Note”, G-20 Finance Ministers and Central Bank Governors’ Meetings, July 9–10, 2021, https://www.imf.org/external/np/g20/070721.htm
Kose, M. Ayhan, Sergio Kurlat, Franziska Ohnsorge, and Naotaka Sugawara. “A cross-country database of fiscal space.” Journal of International Money and Finance 128 (2022): 102682(1-19). (data at https://www.worldbank.org/en/research/brief/fiscal-space)
MPFD Policy Briefs, “An assessment of fiscal space for COVID-19 response and recovery in Asia-Pacific developing countries” 2020, https://www.unescap.org/resources/mpfd-policy-brief-no-116-assessment-fiscal-space-covid-19-response-and-recovery-asia
OECD , “Tax and Fiscal Policies after the COVID-19 Crisis: OECD Report for the G20 Finance Ministers and Central Bank Governors”, (2021) , https://www.oecd.org/tax/tax-policy/tax-and-fiscal-policies-after-the-covid-19-crisis.htm
Polity IV Database, Centre for Systemic Peace, https://www.systemicpeace.org/globalreport.html
Tandon, Ajay, Valeria Oliveira Cruz, Aarushi Bhatnagar, Hui Wang, Trina Haque and Manoj Jhalani, “Financing health care in the WHO South-East Asia Region: time for a reset” WHO South-East Asia Journal of Public Health 10, Supplement 1 (2021) , 1-10
Tandon, Ajay, Jewelwayne Cain, Christoph Kurowski, and Iryna Postolovska, “Intertemporal Dynamics of Public Financing for Universal Health Coverage: Accounting for Fiscal Space Across Countries”. Health, Nutrition, and Population Discussion Paper, World Bank, (2019), https://elibrary.worldbank.org/doi/abs/10.1596/31211
Thomas, Steve, Anna Sagan, James Larkin, Jonathan Cylus, Josep Figueras, and Marina Karanikolos, “Strengthening health systems resilience Key concepts and strategies” Policy Brief 36, World Health Organization, (2020), https://apps.who.int/iris/handle/10665/332441
Thomson, Sarah, Jorge Alejandro García-Ramírez, Baktygul Akkazieva, Triin Habicht, Jonathan Cylus and Tamás Evetovits, “How resilient is health financing policy in Europe to economic shocks? Evidence from the first year of the COVID-19 pandemic and the 2008 global financial crisis” Health Policy 126, no 1 (2022): 7-15
WDI Data, World Bank, https://data.worldbank.org/indicator/NY.GDP.PCAP.CD
Appendix
| Percent of GDP | ||||||||||
| G20: Advanced economies | Above-the-line measures | Liquidity support | ||||||||
| Additional spending or foregone revenues | Accelerated spending / deferred revenue | Below the line measures: equity injections, loans, asset purchase or debt assumptions. | Contingent liabilities | |||||||
| Subtotal | Health sector | Non-health sector | Subtotal | Guarantees | Quasi-fiscal operations | |||||
| Australia | 18.4 | 1.0 | 17.4 | 1.8 | 0.8 | 1.0 | ||||
| Canada | 15.9 | 2.8 | 13.1 | 3.9 | 4.0 | 0.2 | 3.7 | |||
| European Union | 3.8 | 0.0 | 3.8 | 6.7 | 6.1 | 0.6 | ||||
| France | 9.6 | 1.5 | 8.2 | 3.0 | 15.2 | 0.7 | 14.5 | |||
| Germany | 15.3 | 1.8 | 13.6 | 27.8 | 3.0 | 24.8 | ||||
| Italy | 10.9 | 1.2 | 9.7 | 0.4 | 35.3 | 0.2 | 35.1 | |||
| Japan | 16.7 | 2.1 | 14.6 | 0.5 | 28.3 | 2.9 | 25.4 | |||
| Korea | 6.4 | 0.7 | 5.7 | 1.7 | 10.1 | 3.7 | 6.5 | |||
| Spain | 8.4 | 1.7 | 6.7 | 0.0 | 14.4 | 0.1 | 13.4 | 0.9 | ||
| United Kingdom | 19.3 | 4.8 | 14.4 | 0.6 | 16.7 | 0.0 | 16.7 | |||
| United States | 25.5 | 3.3 | 22.2 | 0.1 | 2.4 | 0.3 | 2.2 | |||
| G20: Emerging markets | ||||||||||
| Argentina | 5.3 | 1.3 | 4.1 | 0.0 | 2.6 | 0.3 | 2.3 | |||
| Brazil | 9.2 | 1.5 | 7.8 | 3.1 | 6.2 | 1.1 | 5.1 | |||
| China | 4.8 | 0.1 | 4.6 | 1.6 | 1.3 | 0.4 | 0.9 | |||
| India | 4.1 | 0.5 | 3.6 | 0.7 | 6.2 | 0.3 | 5.3 | 0.6 | ||
| Indonesia | 9.3 | 2.0 | 7.3 | 0.9 | 0.2 | 0.6 | ||||
| Mexico | 0.7 | 0.4 | 0.2 | 0.4 | 1.2 | 0.1 | 0.0 | 1.1 | ||
| Russia | 5.0 | 0.7 | 4.3 | 0.4 | 1.5 | 0.5 | 0.5 | 0.5 | ||
| Saudi Arabia | 2.6 | 2.1 | 0.5 | 1.6 | 1.0 | 1.0 | ||||
| South Africa | 5.3 | 0.7 | 4.6 | 0.9 | 4.1 | 4.0 | 0.1 | |||
| Turkey | 3.5 | 0.4 | 3.1 | 1.4 | 9.6 | 0.4 | 6.4 | 2.8 | ||
Source- IMF Fiscal Monitor Database
Appendix 2
| USD Billion | ||||||||||
| G20: Advanced economies | Above the line measures | Liquidity support | ||||||||
| Additional spending or foregone revenues | Accelerated spending / deferred revenue | Below the line measures: equity injections, loans, asset purchase or debt assumptions. | Contingent liabilities | |||||||
| Subtotal | Health sector | Non-health sector | Subtotal | Guarantees | Quasi-fiscal operations | |||||
| Australia | 250 | 14 | 236 | 24 | 10 | 14 | ||||
| Canada | 262 | 46 | 216 | 68 | 65 | 4 | 61 | |||
| European Union | 488 | 0 | 488 | 873 | 799 | 74 | ||||
| France | 253 | 39 | 214 | 79 | 399 | 18 | 381 | |||
| Germany | 589 | 70 | 519 | 1058 | 114 | 944 | ||||
| Italy | 205 | 23 | 183 | 8 | 665 | 4 | 661 | |||
| Japan | 844 | 105 | 739 | 27 | 1429 | 147 | 1282 | |||
| Korea | 105 | 12 | 93 | 28 | 166 | 60 | 106 | |||
| Spain | 107 | 22 | 86 | 0 | 184 | 1 | 172 | 11 | ||
| United Kingdom | 522 | 131 | 391 | 16 | 453 | 1 | 452 | |||
| United States | 5328 | 687 | 4641 | 18 | 510 | 56 | 454 | |||
| G20: Emerging markets | ||||||||||
| Argentina | 21 | 5 | 16 | 0 | 10 | 1 | 9 | |||
| Brazil | 133 | 21 | 112 | 45 | 89 | 15 | 73 | |||
| China | 711 | 21 | 689 | 232 | 193 | 58 | 135 | |||
| India | 109 | 14 | 95 | 18 | 166 | 9 | 141 | 16 | ||
| Indonesia | 99 | 22 | 77 | 9 | 2 | 7 | ||||
| Mexico | 7 | 5 | 2 | 4 | 13 | 1 | 0.3 | 12 | ||
| Russia | 74 | 11 | 63 | 6 | 22 | 8 | 7 | 7 | ||
| Saudi Arabia | 18 | 14 | 4 | 11 | 7 | 7 | ||||
| South Africa | 18 | 2 | 15 | 3 | 12 | 12 | 0 | |||
| Turkey | 25 | 3 | 22 | 10 | 69 | 3 | 46 | 20 | ||
Source- IMF Fiscal Monitor Database
Technical Appendix
A: Construction of Banking Independence Index
Time series data for banking independence indicator, which has been used in Garriga A. C. (2016) is collected for the G20 countries from Anna Carolina Garriga’s website. We have taken LVAU-Garriga measure (higher values imply higher independence). For a given country, an average has been taken over different years (2005-2012, as no later data is available) and this average value has been used as the country’s Banking Independence Index for all the years, as the numbers do not change over time.
B: Construction of Democracy Index
Data for polity has been collected from the website of Center for Systemic Peace. For each G20 country, we have got a time series for polity (democracy) score. Next, the average of this series is calculated for each country (2000-2018). Each country’s mean is then scaled up by 10, to get rid of negative signs.
If Xi represents this mean for the ith country, the final Democracy Index for the ith country is calculated as (Xi-Lowest value for all countries (0))/ (Highest value (20)- Lowest value (0) for all countries). The index lies between 0 and 1.
C: Year Effect and Marginal Effect
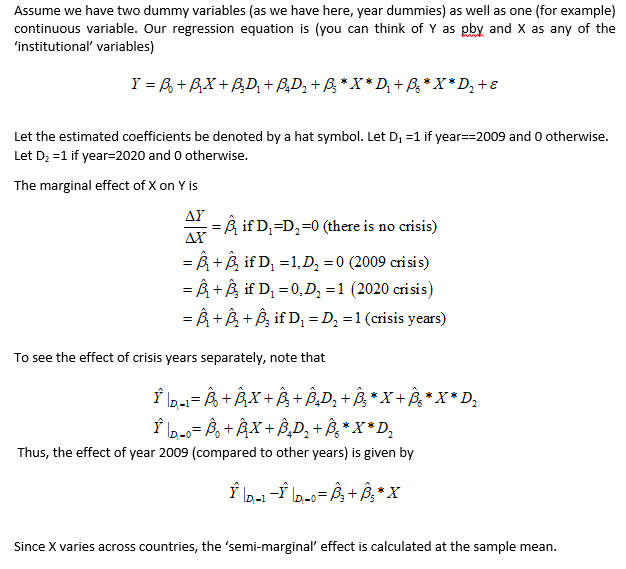
D: Results of Co-Integration Test
Table D1: All variables are % of GDP)
| Variables | Statistic |
| Govt Debt and Primary Balance (ADF) | -2.94 (***) |
| Govt Debt and Fiscal Balance (ADF) | 4.42 (***) |
| Primary Balance and Fiscal Balance (Modified Phillips Perron) | 2.25 (**) |
E: Regression Model Used
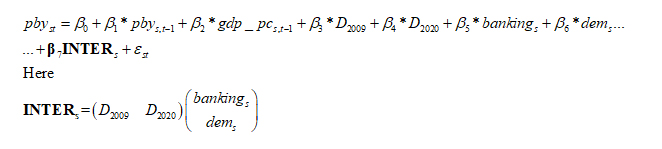
The above equation is measured with random effect panel regression.
[a] Our analysis reveals that these variables are co-integrated (technical appendix D). Hence, we focus only on primary balance (= tax- expenditure) as percentage of GDP representing the fiscal space.
[b] See technical appendix A.
[c] See technical appendix B.
[d] Regression model and explanation of coefficients are in technical appendix E and C, respectively.

