Task Force 4: Refuelling Growth: Clean Energy and Green Transition
Abstract
The circular carbon economy (CCE) is a flexible, technology-neutral, and inclusive framework for climate change mitigation, and was first endorsed by the G20 leaders in 2020. The concept enables a holistic assessment of all available energy and emissions management technologies, and can support the design of net-zero emissions pathways adapted to a country’s national circumstances, resource endowments, and competitive advantages.
The CCE Index, which aims to quantify a country’s CCE progress and potential, was developed by the King Abdullah Petroleum Studies and Research Center (KAPSARC) in 2021. It puts forward a set of common indicators suitable for diverse country contexts. The 2022 edition of the CCE Index comprises 43 indicators under two sub-indices: performance and enablers. The CCE Index is made available for 64 G20 and non-member countries, accounting for approximately 90 percent of global GDP and greenhouse gas (GHG) emissions. A dedicated web portal[a] makes available country-specific index results via various simulation tools to support a country’s policymaking process for its net-zero pathways.
The CCE Index can serve as a policy tool for the G20 in identifying cross-country transition gaps, setting the stage for constructive policy discussions and collaboration. This policy brief outlines how the G20 can use the CCE Index as an assessment framework to map and agree on priority actions and track implementation on the road to global net-zero emissions.
1. The Challenge
The Sixth Assessment Report of the Intergovernmental Panel on Climate Change (IPCC) confirms that the gap between current global greenhouse gas (GHG) emissions and emissions level needed to limit global warming in line with the Paris Agreement remains significant, and the GHG levels resulting from the implementation of countries’ nationally determined contributions (NDCs) would “make it likely that warming will exceed 1.5°C during the 21st century and make it harder to limit warming below 2°C” (IPCC, 2023). In addition to the emissions gap, the IPCC report draws attention to the financing gap, noting that “finance flows fall short of the levels needed to meet climate goals across all sectors and regions” (IPCC, 2023). To meet the Paris Agreement’s temperature goals, not only will emissions need to fall faster, but support to developing countries will need to accelerate and scale up significantly. While there is consensus on this dual challenge, there is no a shared language and common framework for defining the necessary energy and economic transitions.
Medium- and long-term targets have, in recent years, become a common way for developed and developing countries alike to signal to markets how fast they intend to mitigate emissions. As of April 2023, 194 countries had set NDCs and 130 had announced net-zero CO2 or GHG targets (UNFCCC 2023; ECIU 2023). The G20 countries accounts for close to 80 percent of global GHG emissions. All G20 member countries have an emissions-based NDC target, and the G20 has collectively committed to “achieve global net zero greenhouse gas emissions/carbon neutrality by or around mid-century” (G20 Indonesia, 2022).
Achieving net zero requires significant resources. Many developing countries have individually indicated either an estimate of the total cost to implement their NDCs, or the support needed towards this (UNFCCC, 2023). Estimates of the global investment needs range between US$4 trillion and US$8 trillion depending on scenarios and assumptions, e.g., IRENA (2021), BNEF (2021), IEA (2021), and McKinsey & Company (2022). Some attempts have been made to quantify the gap between the net-zero transition investment needs and actual investment flows. For example, a recent study finds that although all countries are lagging on the transition investment agenda, these gaps are strikingly wide in developing countries. It also shows that climate finance flows are limited in size and unequally distributed (Yilmaz et al., 2022).
While the current status of countries’ emissions, emissions targets, finance gaps, and support needs are well documented, assessing where they stand today and how they are positioned to make progress toward net-zero and emissions circularity in comparison to each other remains complicated. A part of this stems from each country’s hesitance to be compared with the other given their widely different national circumstances and development trajectories. This hesitance is well-founded: countries are different and therefore hard to compare with a single metric. It also relates to a country’s status under the United Nations Framework Convention on Climate Change (UNFCCC), its Paris Agreement (Annex I and non-Annex I, or developed and developing), and their related historical responsibilities and different capabilities to take climate action. Countries also have different national endowments and historical contingencies and, therefore, varied strengths and weaknesses in relation to climate change mitigation and net-zero transitions. Consequently, each country’s pathway to net-zero will therefore look different. Nevertheless, cross-country comparisons are useful for various purposes, including identifying leaders and those in danger of being left behind, as well as individual strengths and weaknesses. This, in turn, can help facilitate international cooperation to bridge gaps and bring everyone along the transition.
A further major reason for the absence of meaningful, shared country comparison frameworks for net-zero transitions is a lack of consensus on which mitigation technologies and approaches should be prioritised—or indeed accepted—in the policy mix. For example, many countries feel excluded from transition narratives that emphasise the need to exclusively focus on renewable energy and energy efficiency, which seems unfeasible to them in the medium term. Given the urgency of reducing emissions, it is, however, widely agreed that countries should implement all possible technologies, as rapidly as feasible, and in the most cost-effective manner.
2. The G20’s role
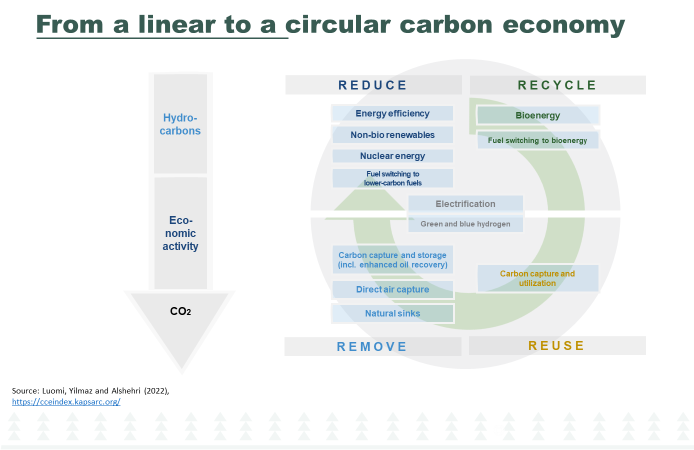
In 2020, the G20 Summit endorsed the circular carbon economy (CCE) and its framework of ‘reducing’, ‘recycling’, ‘reusing’, and ‘removing’ CO2 and other GHG emissions to achieve carbon neutrality or net-zero GHG emissions as a “voluntary, holistic, integrated, inclusive, pragmatic, and complementary approach to promote economic growth,” while “recognizing the key importance and ambition of reducing emissions, taking into account system efficiency and national circumstances” (G20 Saudi Arabia, 2020).
The CCE concept is based on a technology-neutral approach to net-zero transitions that is based on the four key pillars (‘reducing’, ‘recycling’, ‘reusing’, and ‘removing’) which relate to the management of carbon and related emission flows. In addition to drawing attention to the necessity of technology-neutral approaches to delivering the needed transitions, the concept plays to each country’s strengths. It also stresses the need to account for cost-effectiveness, and other policy drivers including economic and social sustainability, when pursuing carbon circularity (Luomi, Yilmaz and Alshehri, 2021b).
The concept therefore easily adapts to diverse national circumstances, resource endowments, and competitive advantages, while keeping global mid-century emissions neutrality and the Paris Agreement’s emission goals as its ultimate target. It can be employed as a systems-oriented climate change mitigation assessment framework at the national, regional, or global levels to measure the gap between current and net-zero emissions, to gauge a country’s strengths and weaknesses, and to create technology-specific pathways and enabling policies to support the transition (Luomi, Yilmaz and Alshehri, 2021a).
The CCE Index was developed by researchers at the King Abdullah Petroleum Studies and Research Center researchers to support countries in using the CCE concept as a framework to conceptualise, measure, and plan their net-zero transitions (Luomi, Yilmaz and Alshehri, 2021b). A composite indicator, the Index currently includes 64 countries (including the G20 countries), covering approximately 90 percent of the global GDP and emissions, and is updated annually. By using 43 quantitative indicators from reputable and harmonised data sources, it gauges and compares how well countries are currently performing on carbon circularity and CCEs (CCE Performance), in addition to how they are placed to make progress toward net-zero emissions and CCEs in line with their policy targets (CCE Enablers).[b]
The CCE Index can contribute to solving the challenge of not having a shared language and a common framework for framing net-zero transitions that allows for cross-country comparisons. The CCE Index, among other things, allows for estimating implementation gaps and areas; strengths and weaknesses of countries, and where stronger countries can support others; and areas where international cooperation is needed.
3. Recommendations to the G20
The authors propose that the G20 use the CCE Index as a policy prioritisation tool and assessment and tracking framework to identify urgent actions and to track implementation on the road to net-zero and CCEs, in the following ways:
Proposal 1: Use the CCE Index to identify and agree on the major areas of implementation gaps on the road to net-zero emissions that require urgent attention within the G20 group and globally. Set quantitative targets to track progress.
Below, in Figures 1-3, we illustrate how such gaps can be identified by using the results of the 2022 edition of the CCE Index.
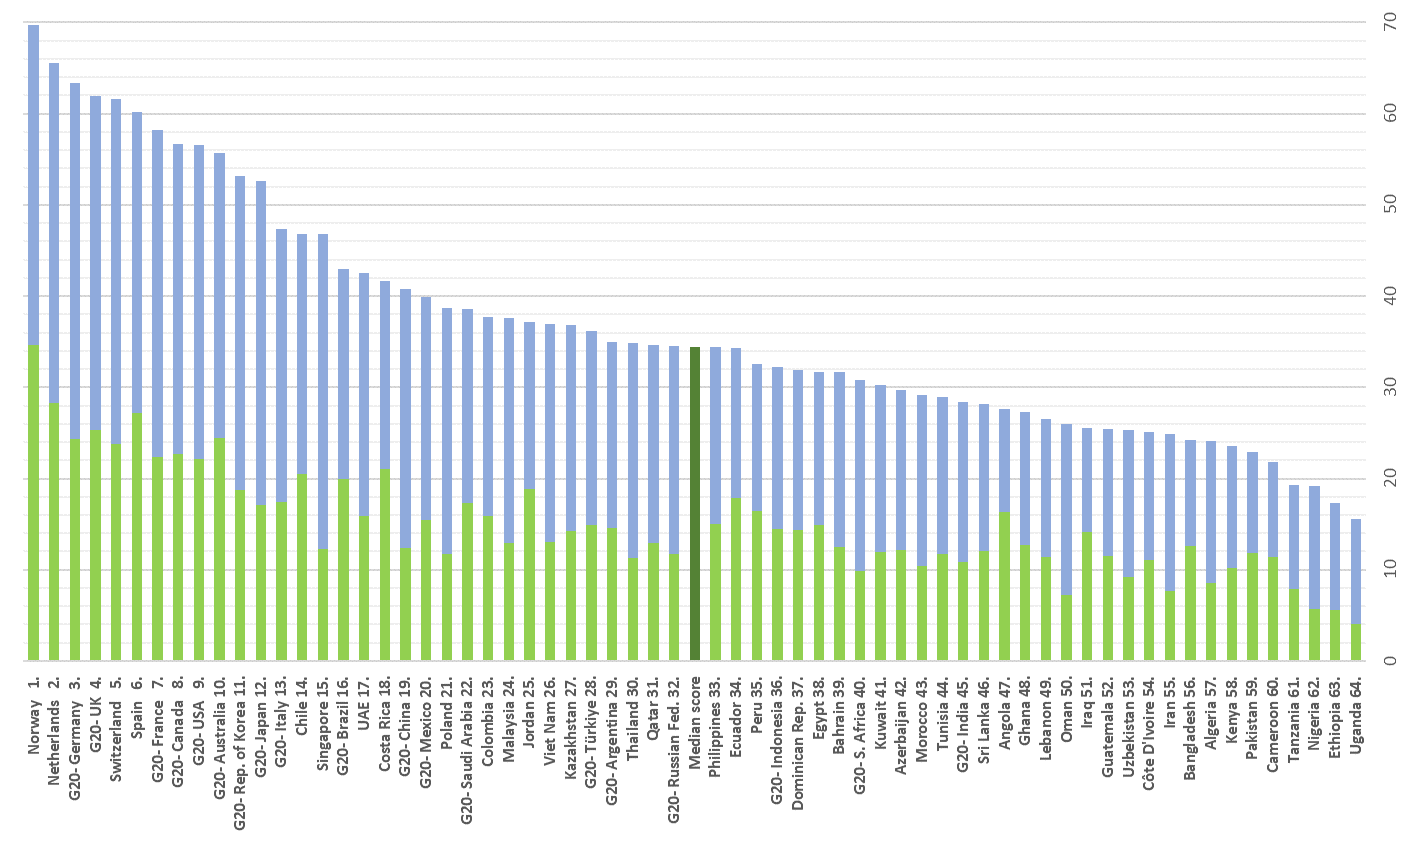
Figure 1 displays the 2022 CCE Index results by countries included in the study along with their G20 status. The distribution of Index scores shows that there is a large variation across the G20 member and non-member countries. While generally developed G20 member countries are leading with high scores and 16 members are above the median, three developing G20 members are located below the median. The difference between the highest- and lowest-ranking G20 member country is vast. Germany, the highest-scoring G20 member, records a score 2.2 times higher than India, the lowest scoring G20 member.
Figure 1: 2022 CCE Index results – Highlighting G20 member country rankings
Source: Luomi, Yilmaz and Alshehri (2022a).
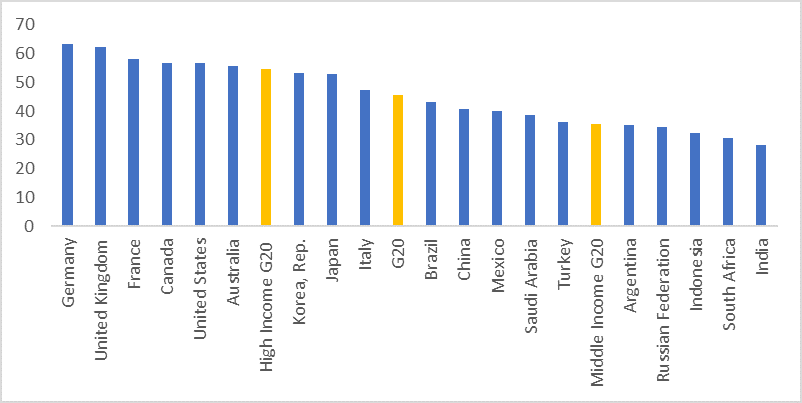
Figures 2 and 3 show the average CCE Index scores across different country groups, including G20, high-income G20, and middle-income G20 member countries, along with the full list of G20 member countries. As demonstrated in Figure 2, the high-income G20 member countries’ average score is the highest among all the groups—even higher than the Organisation of Economic Cooperation and Development (OECD) average, while middle-income G20 members’ average score is below the global average. As country-level results depicted in Figure 3 show, Germany, the UK, France, Canada, the US, and Australia record the highest scores, above the high-income G20 average. South Korea, Japan and Italy have scores above the G20 average. The remaining half of G20 members score below the G20 average. Overall, large transition gaps are already evident from the figures.
Figure 2: Average 2022 CCE Index scores by country group
d
Figure 3: Average CCE Index scores across G20 member countries

Source: Authors’ construction from the CCE Index results, Luomi, Yilmaz and Alshehri (2022a).
Note: Following the World Bank’s income classification, ‘high-income G20’ includes Australia, Canada, Germany, France, the UK, Italy, Japan, South Korea, Saudi Arabia, and the US; and ‘middle-income G20’ includes Argentina, Brazil, China, Indonesia, India, Mexico, Russia, Turkey and South Africa. ‘Global’ contains all 64 countries covered by the 2022 CCE Index.
The same exercise illustrated above (Figures 1-3) can be conducted at any level of the CCE Index: CCE Performance, CCE Enablers, any of the five thematic areas under CCE Enablers (Policies and Regulation; Technology, Knowledge and Innovation; Finance and Investment; Business Environment; and System Resilience), or any of the individual 35 CCE Index indicators.[c]
Proposal 2: Use the CCE Index to map leading countries in specific CCE technology or enabler areas to identify how these leaders can support developing countries within and outside the G20 in their net-zero transitions.
Below, in Figures 4-5, we illustrate how leaders in specific CCE technology or enabler areas can be identified by using the 2022 edition of the CCE Index.
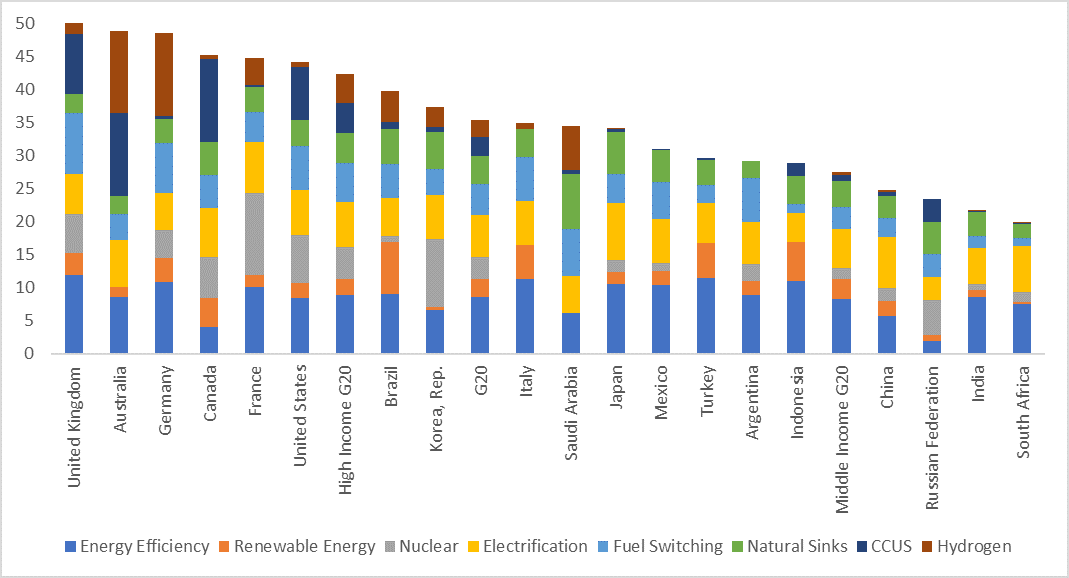
Figure 4 provides a breakdown of CCE Performance results for G20 member countries. Top-performing countries utilise a higher number of the measured technologies and approaches at a larger scale and indicate higher performance in these areas, while the bottom-performing members utilise only certain technologies and on average perform worse in a higher number of areas. Among different technologies, for instance, Brazil, Italy, Turkey, and Indonesia record the highest utilisation of renewable energy relative to the total primary consumption of energy. Carbon capture, utilisation, and storage (CCUS) pipelines are globally dominated by high-income G20 members, such as the UK, Australia, Canada, and the US. Saudi Arabia, South Korea, and Japan, in turn, are planning for significant production and/or utilisation of clean hydrogen in the near term.
Figure 4: CCE Performance sub-index scores for G20 countries
Source: Authors’ construction from the CCE Index results, Luomi, Yilmaz and Alshehri (2022a).
Note: Following the World Bank’s income classification, ‘high-income G20’ includes Australia, Canada, Germany, France, the UK, Italy, Japan, South Korea, Saudi Arabia, and the US; and ‘middle-income G20’ includes Argentina, Brazil, China, Indonesia, India, Mexico, Russia, Turkey and South Africa. ‘Global’ contains all 64 countries covered by the 2022 CCE Index.
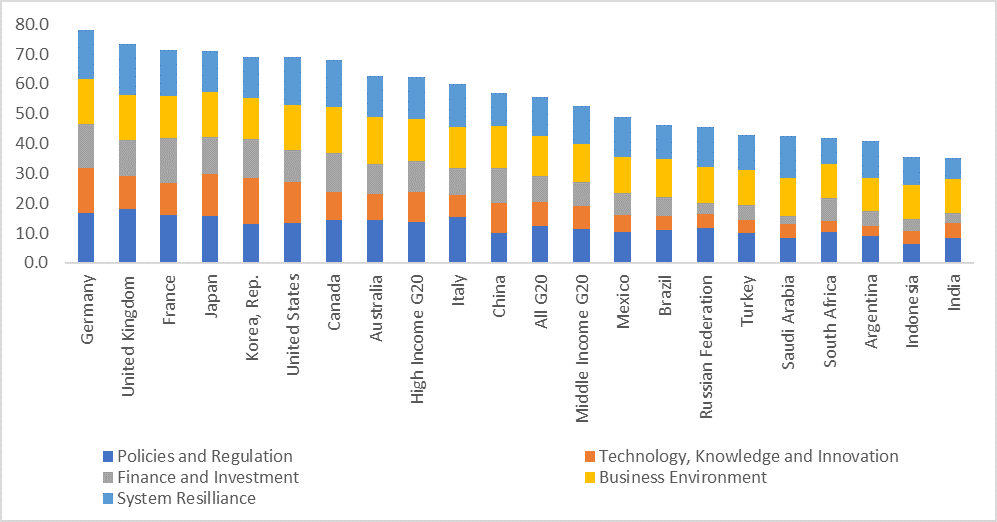
Figure 5 displays a breakdown of the five enabling dimensions of the CCE Enablers’ sub-index for G20 member countries, along with group averages. The largest gaps across countries are found in finance and investment, and in technology, knowledge, and innovation. Under the former, access to sustainable finance and utilisation of carbon market instruments constitute particular gaps in many developing country members. Under the latter, a further breakdown of the results indicates that clean energy technology generation is highly concentrated in the developed country G20 members (eg., South Korea, Japan, and Germany), and diffusion of these technologies to developing country members remains limited.
Figure 5: CCE Enablers sub-index scores for G20 countries
Source: Authors’ construction from the CCE Index results, Luomi, Yilmaz and Alshehri (2022a).
Note: Following the World Bank’s income classification, ‘high-income G20’ includes Australia, Canada, Germany, France, the UK, Italy, Japan, South Korea, Saudi Arabia, and the US; and ‘middle-income G20’ includes Argentina, Brazil, China, Indonesia, India, Mexico, Russia, Turkey and South Africa. ‘Global’ contains all 64 countries covered by the 2022 CCE Index.
Individual countries can undertake the same exercise as illustrated above to identify their respective strengths and weaknesses in CCE Performance and the five CCE Enabler areas highlighted in Figures 4 and 5. This will allow countries to identify where they can support each other and non-G20 developing countries, and also where G20 countries may need support themselves.
Proposal 3: Enhance international cooperation for net-zero and CCE transitions in areas identified by taking the steps outlined in proposals 1 and 2.
The CCE Index also allows for identifying areas where accelerated implementation is needed and where international cooperation can help or is necessary so that no one is left behind. A mapping of implementation gaps within the G20 and in developing countries globally (Proposal 1), accompanied with a mapping of individual countries’ strengths and weaknesses (Proposal 2), can help inform the identification of areas where multilateral cooperation can help accelerate progress.
For instance, emerging technologies like CCUS and clean hydrogen are deemed necessary for the decarbonisation of hard-to-abate sectors. While hard-to-abate sectors are mostly concentrated in emerging and other developing economies, deployment of CCUS and clean hydrogen in these countries has been slow due to challenges around accessing and leveraging financing for these capital-intensive technologies (Yilmaz, Rouchoudhury and Hatipoglu, 2022).
Proposal 4: Institutionalise the CCE Index as a tracking framework for cooperation to enable net-zero transitions across the G20 and globally.
In order to ensure continuity of the use of the CCE Index over the years, we propose the G20 institutionalise the use of the Index by agreeing, in the Energy or Climate Change Ministers’ Communiqué in 2023, to endorse the CCE Index as a tracking framework for cooperation for net-zero transitions, and to annually track and take stock of progress on cooperation at a Global Circular Carbon Economy Summit, organised as part of the G20 annual events calendar. The summit will also provide opportunities for policymakers, international organisations, and experts to exchange experiences and translate them into stronger policy actions for accelerating cooperation on climate action and sustainable energy transitions, and to help ensure tracking is underpinned by readily available and high-quality national-level data.
Attribution: Faith Yilmaz et al., “Enhancing the G20’s Climate Change Policy Agenda with the Circular Carbon Economy Index,” T20 Policy Brief, May 2023.
Bibliography
Al Shehri T., J.F. Braun, N. Howarth, A. Lanza and M. Luomi. “Saudi Arabia’s Climate Change Policy and the Circular Carbon Economy Approach.” Climate Policy, 23:2, 151-167, (2023) DOI: 10.1080/14693062.2022.2070118
BloombergNEF (BNEF). “New Energy Outlook.” Bloomberg, (2021).
G20 Indonesia. “G20 Bali Leaders’ Declaration.” Bali, Indonesia, 15-16,(2022).
G20 Saudi Arabia. “Leaders’ Declaration Riyadh Summit.” G20 Information Centre, (2020).
Energy & Climate Intelligence Unit et al. “Net Zero Tracker.” Accessed (April 5, 2023).
Intergovernmental Panel on Climate Chang (IPCC). “Synthesis Report of the IPCC Sixth Assessment Report (AR6) – Summary for Policymakers.” (2022).
International Energy Agency (IEA). “Net Zero by 2050: A Road Map for the Global Energy.” IEA (2021).
IRENA “World Energy Transitions Outlook 2022: 1.5°C Pathway”. International Renewable Energy Agency, Abu Dhabi. (2021)
Luomi, M., Yilmaz, F., & Al Shehri, T. “The Circular Carbon Economy Index 2022–Results” (No. ks–2022-dp18). King Abdullah Petroleum Studies and Research Center (KAPSARC). (2022a).
— — —. “The Gulf Cooperation Council and the Circular Carbon Economy: Progress and Potential” (No. ks–2022-dp06). KAPSARC. (2022b).
— — —. “The Circular Carbon Economy Index–Methodological Approach and Conceptual Framework” (No. ks–2021-mp01).KAPSARC. (2021a).
— — —. “The Circular Carbon Economy Index 2021–Methodology” (No. ks–2021-mp02). KAPSARC. (2021b).
— — —. “How the Circular Carbon Economy Index Can Serve Policymaking: Case Study of Saudi Arabia” (No. ks—2021).KAPSARC. (2021c).
McKinsey & Company. “The Net-Zero Transition: What It Would Cost, What It Could Bring.” (2022).
Yilmaz, F, J. Roychoudhury and E. Hatipoglu. “Enhancing Environmental, Social and Governance Frameworks to Scale up Climate Finance.” Policy Brief, TF9: Global Cooperation for SDGs Financing, G20 Indonesia. (2022).
United Nations Framework Convention on Climate Change (UNFCCC) “NDC Registry.” UNFCCC. Accessed (April 4, 2023).
Appendix
This appendix contains further information about the CCE Index. All underlying data, the CCE Index methodology, results and analysis are also available via the CCE Index web portal. Related publications include examples of applying Proposal 1 at sub-index level.
The CCE concept
Figure A1.
CCE Index Methodology
As displayed in Figure A2, the CCE Index has two main building blocks: Performance and Enablers sub-indices. The former aims to capture the current CCE performance of countries, and the latter aims to measure how countries are positioned to accelerate their transitions.
Figure A2.
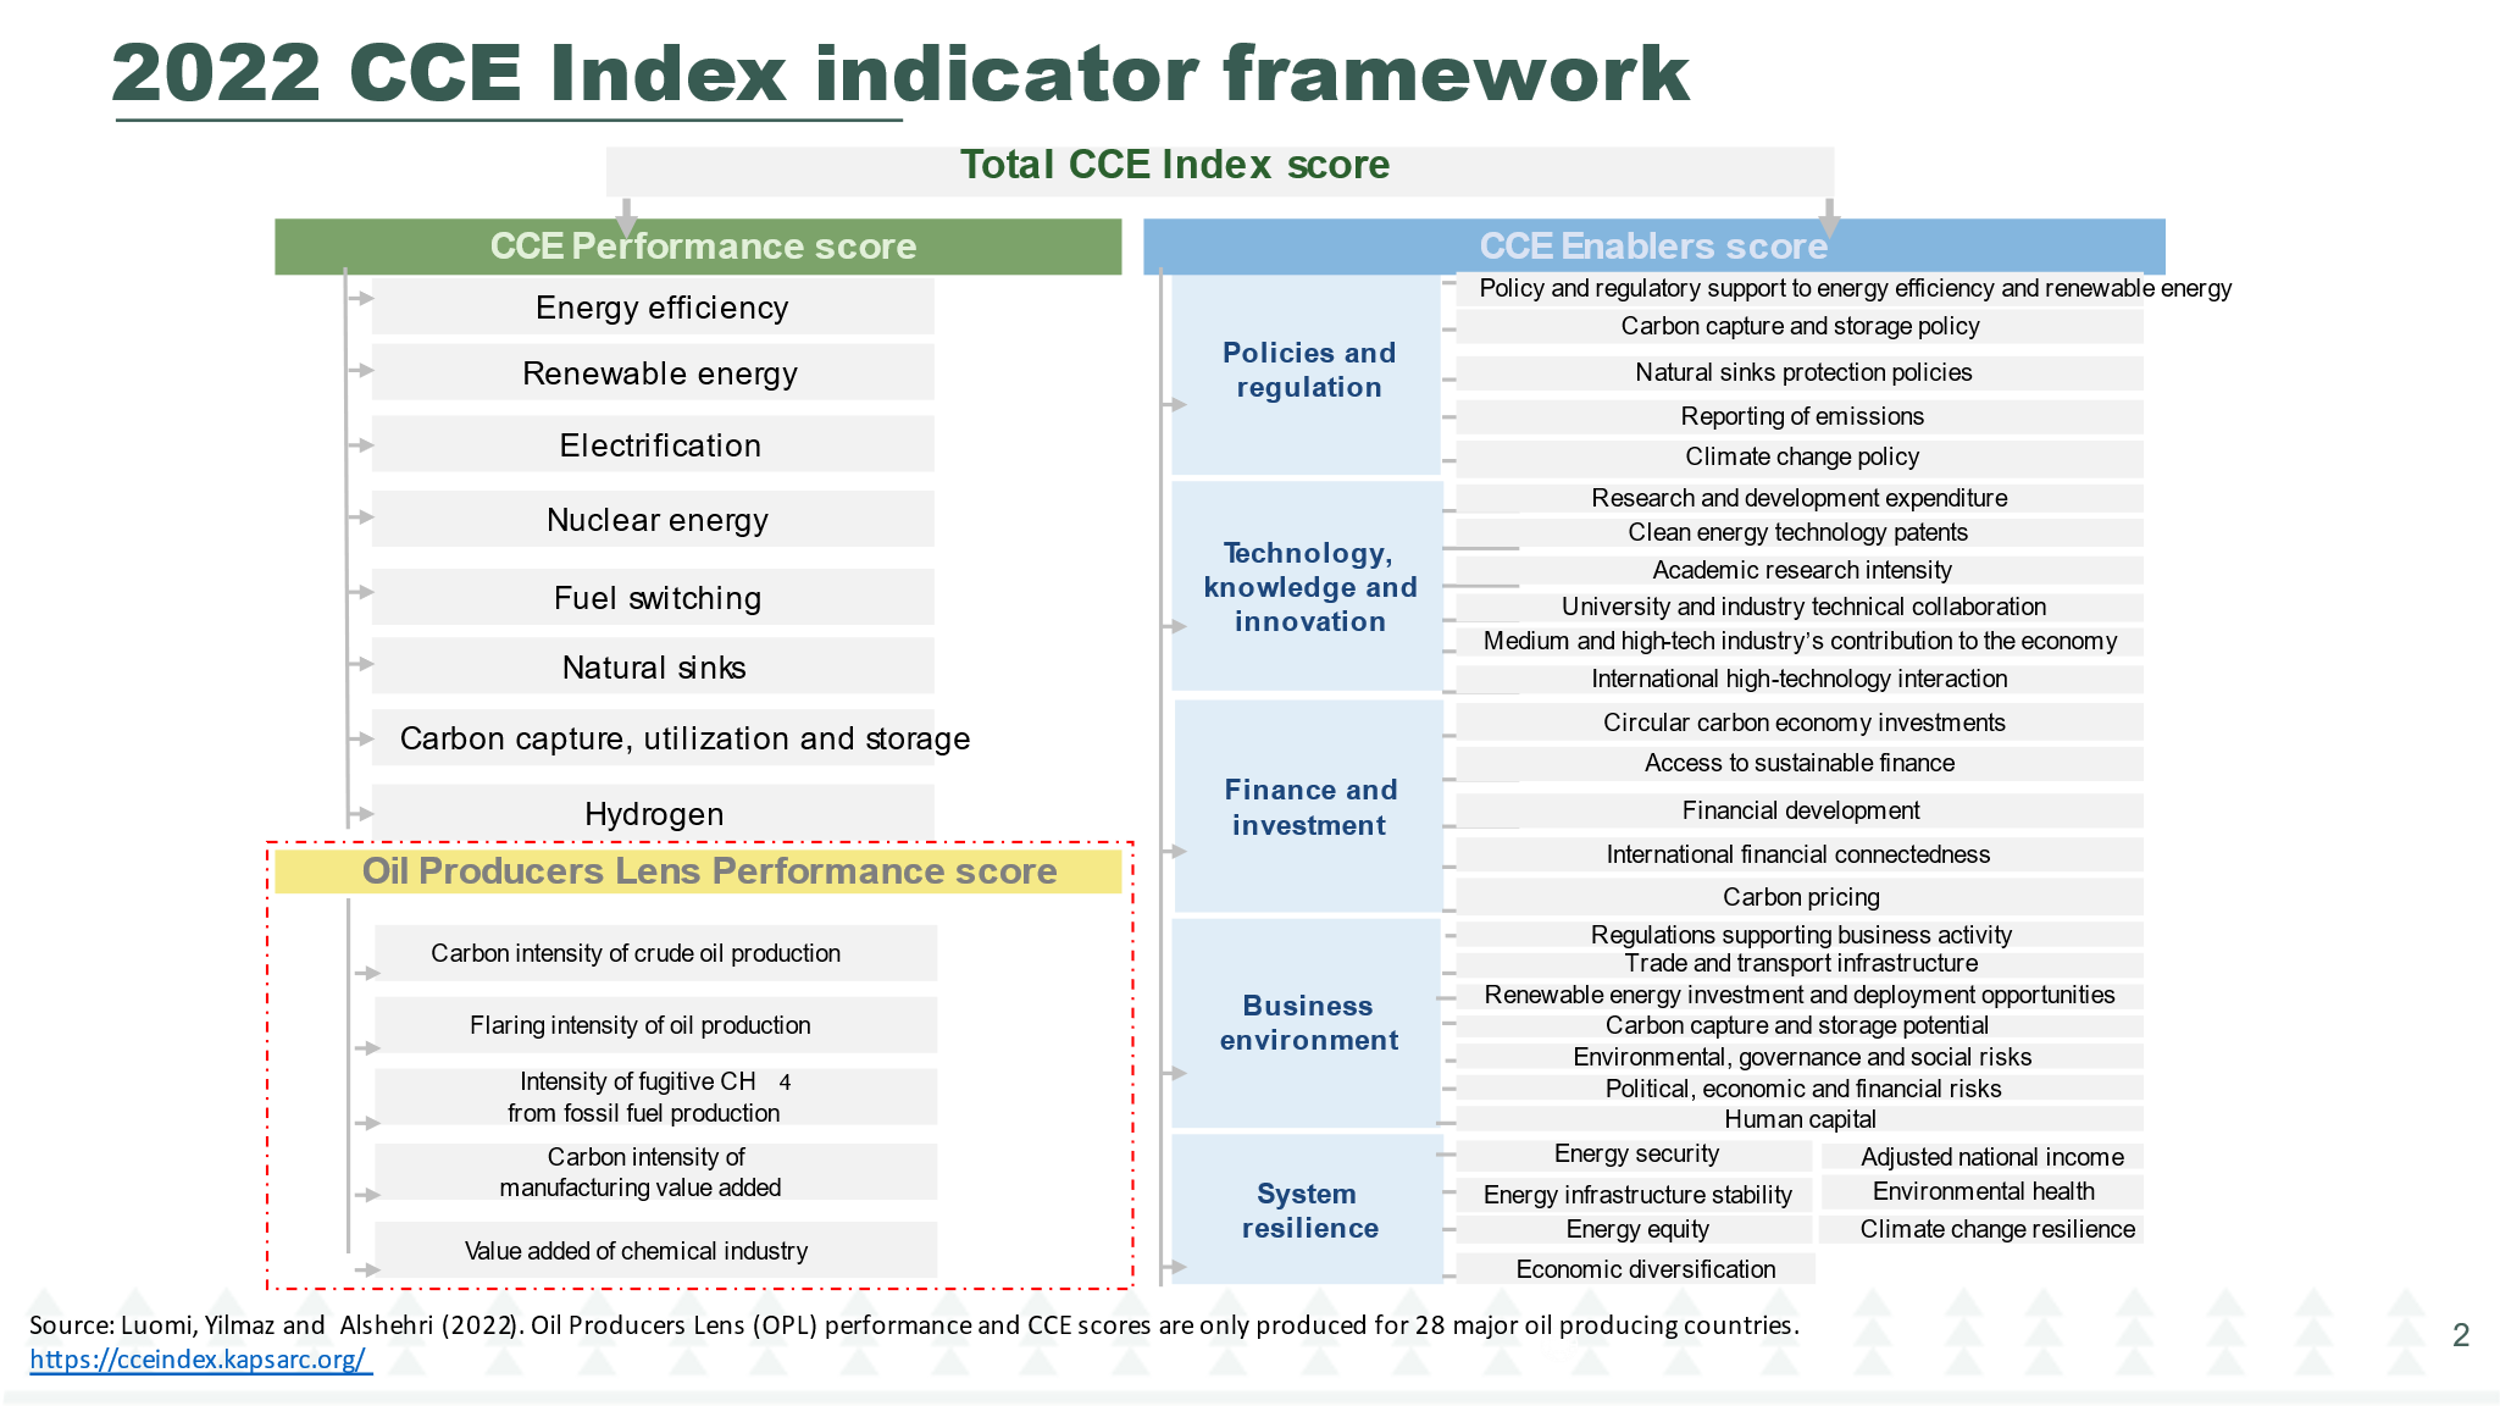
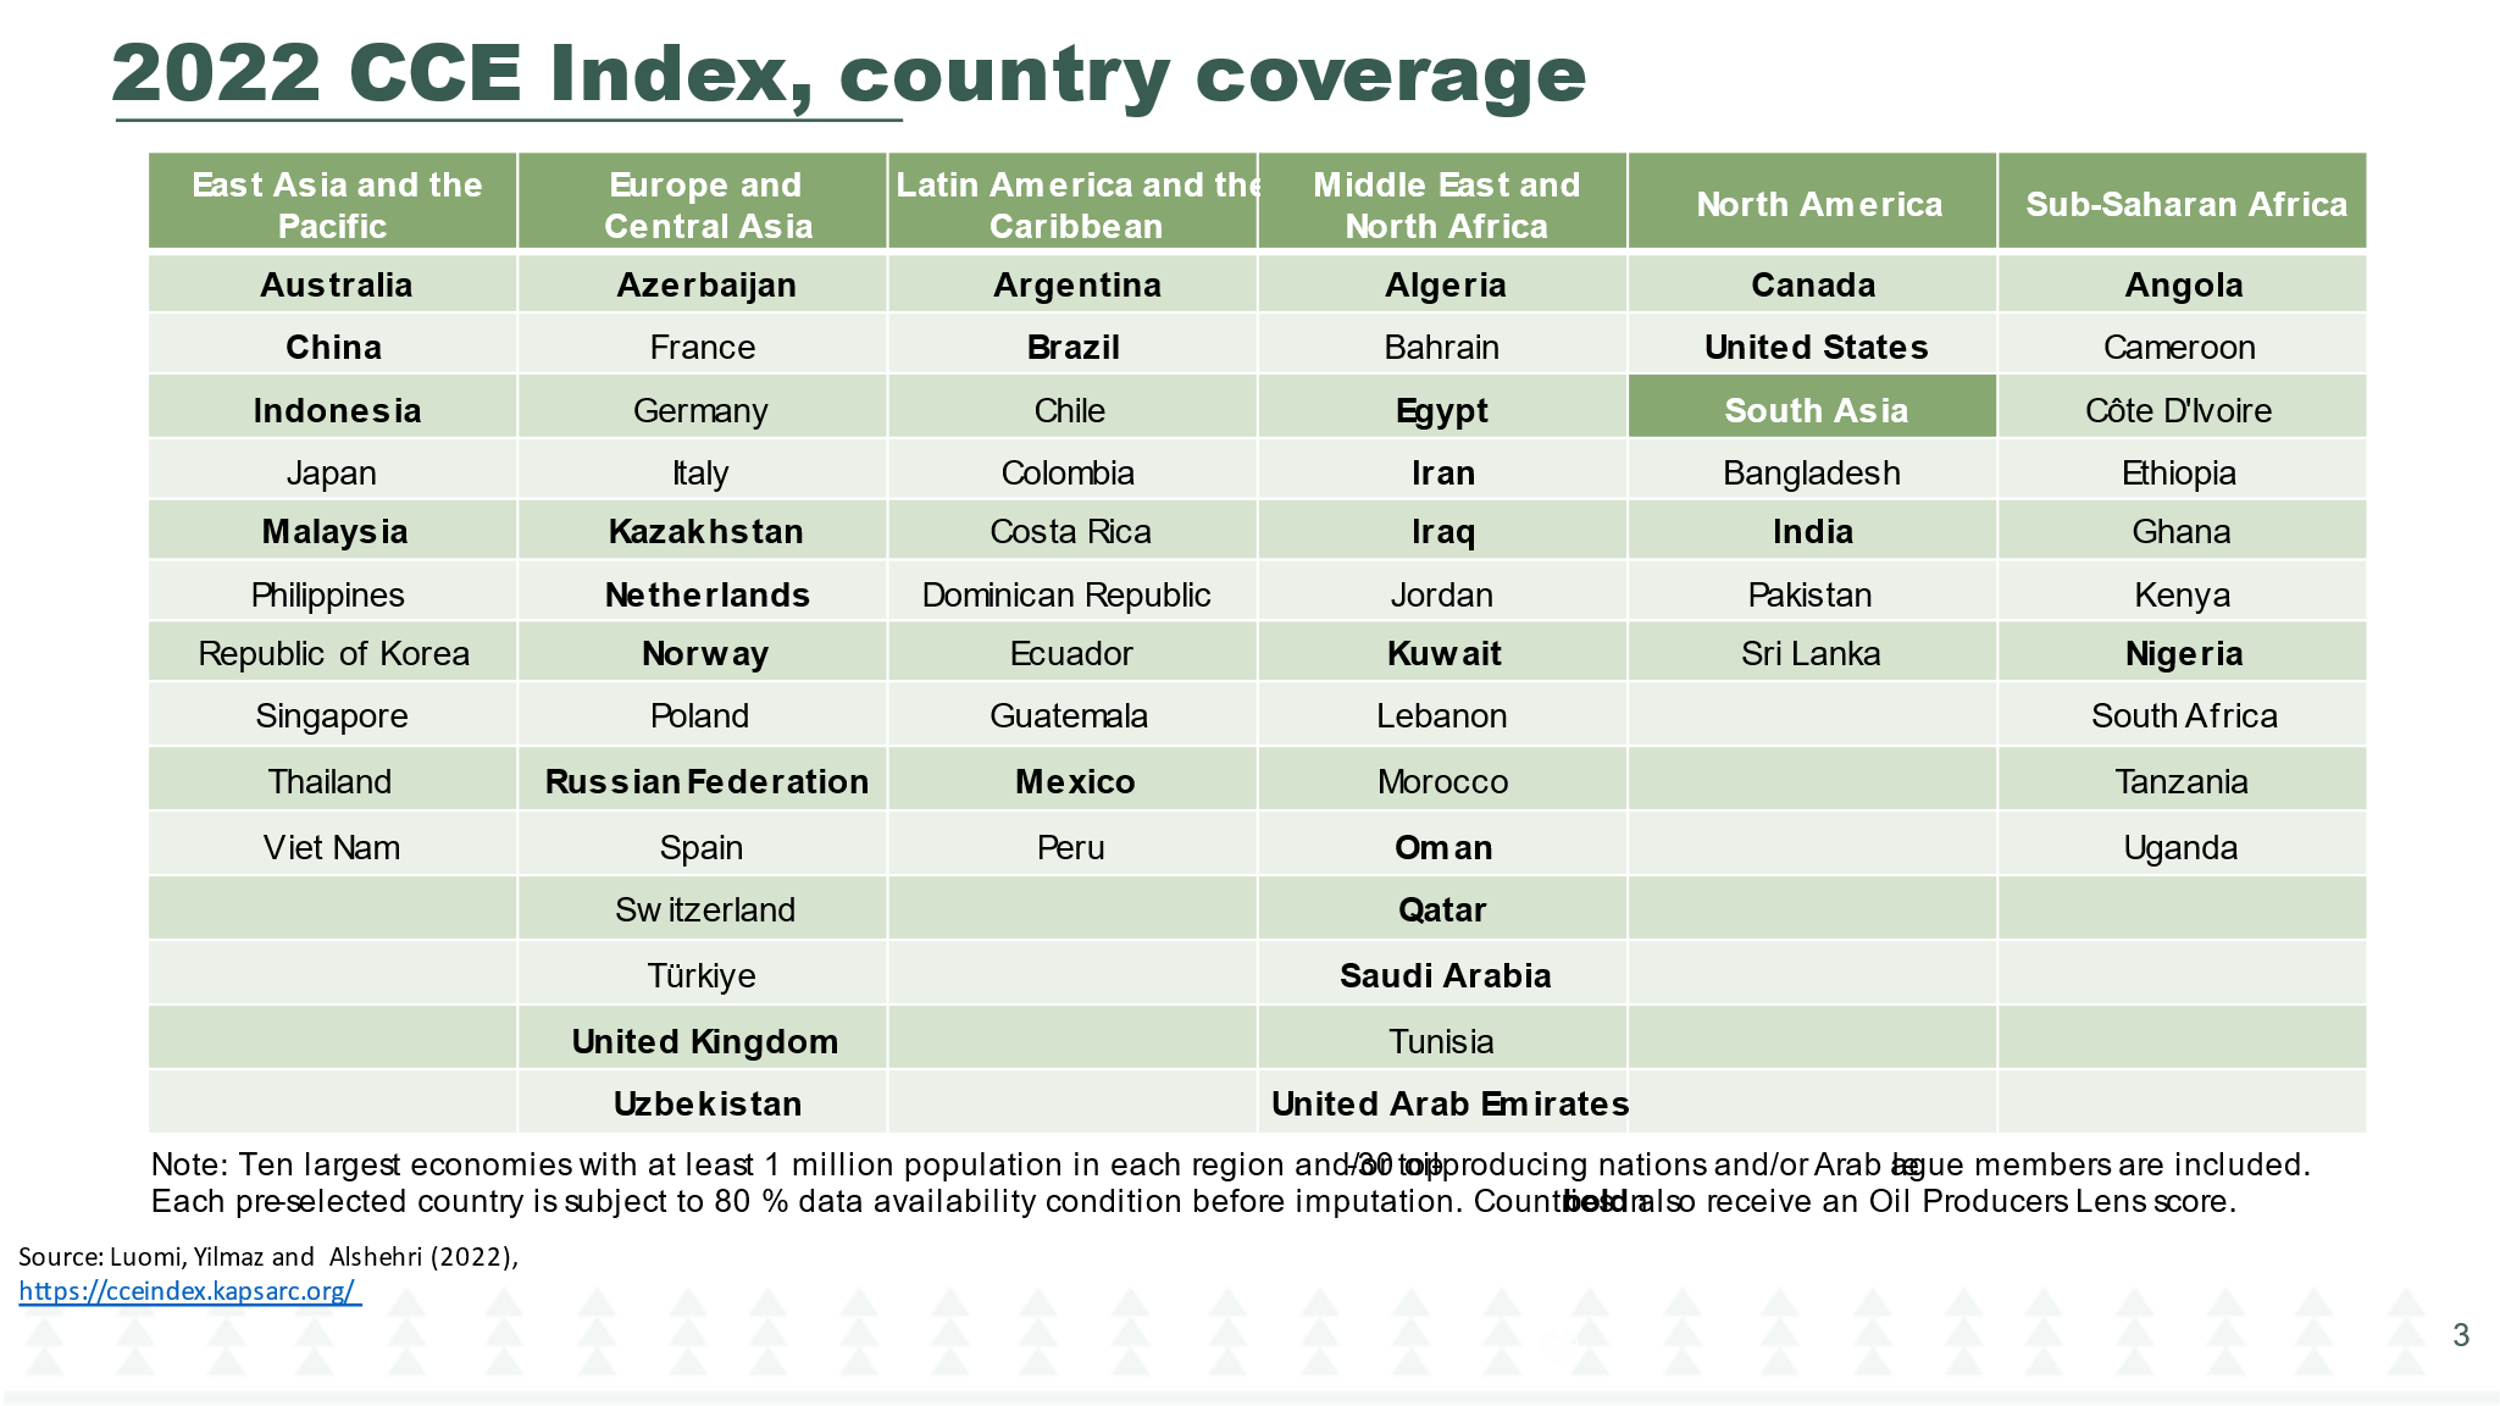
Figure A3.
Applying Proposal 1 to the CCE Performance sub-index
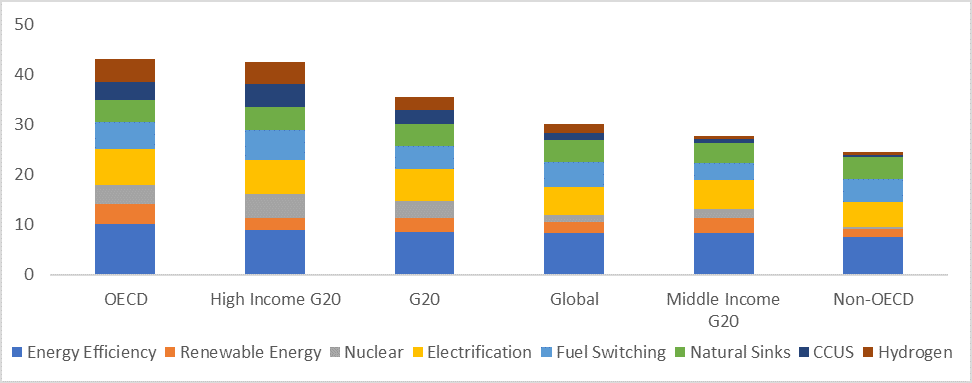
As per the technology agnostic principle of the CCE, the Index covers a wide range of GHG mitigation or management technologies currently utilised globally. Accordingly, the CCE Performance sub-index captures countries’ current performance of utilising these technologies and actions. The current status across different country groups is displayed in Figure A4, which indicates that G20 member countries on average utilise most of the available technologies above the global average. As shown in the figure, high-income G20 members’ utilisation of the major technologies is equivalent to the (Organization for Economic Cooperation and Development) OECD average and well above the overall G20 and global averages. On the contrary, middle-income G20 members indicate lower penetration of these technologies’ relative to the overall G20 and global averages.
Figure A4: Average 2022 CCE Performance sub-index scores by country group
Source: Authors’ construction from the CCE Index results, Luomi, Yilmaz and Alshehri (2022a).
Note: Following the World Bank’s income classification, ‘high-income G20’ includes Australia, Canada, Germany, France, the UK, Italy, Japan, South Korea, Saudi Arabia, and the US; and ‘middle-income G20’ includes Argentina, Brazil, China, Indonesia, India, Mexico, Russia, Turkey and South Africa. ‘Global’ contains all 64 countries covered by the 2022 CCE Index.
More specifically, renewable energy utilisation of middle-income G20 members relative to their economy sizes on average is higher than that of the high-income G20 group; however, their penetration of critical carbon management technologies and hydrogen appears to be largely limited. These technologies are particularly important for the decarbonisation of hard-to-abate sectors (e.g., steel, cement, oil and gas), which often constitute major sectors, and sources of emissions, in emerging economies, including middle-income G20 members. Addressing such bottlenecks will be critical to unlocking these economies’ potential to accelerate their participation in the sustainable energy transition.
Applying Proposal 1 to the CCE Enablers sub-index
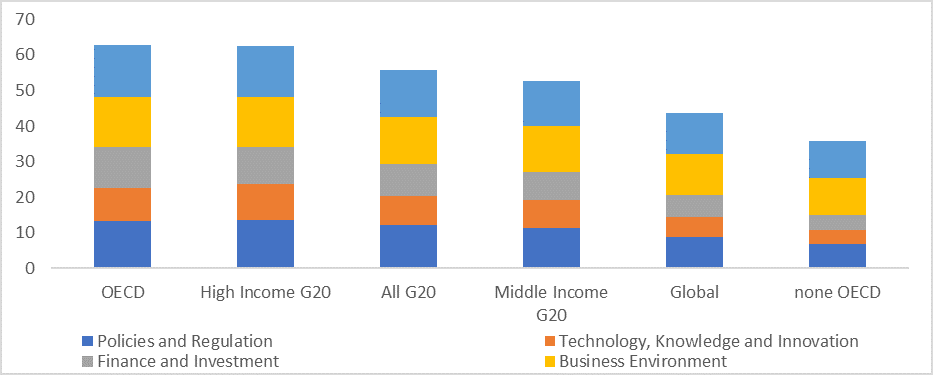
In line with the CCE approach, it is acknowledged that countries have different circumstances and hence, may utilise a different mix of carbon circularity technologies. However, due to shortcomings of enabling factors, countries may not be able to exploit the necessary technologies. This is captured in the CCE Enablers sub-index, which covers five key enabling areas. These include policy and regulation, technology, knowledge and innovation, finance and investment, business environment, and system resilience.
Figure A5: Average 2022 CCE Enablers sub-index scores by country group
Source: Authors’ construction from the CCE Index results, Luomi, Yilmaz and Alshehri (2022a).
Note: Following the World Bank’s income classification, ‘high-income G20’ includes Australia, Canada, Germany, France, the UK, Italy, Japan, South Korea, Saudi Arabia, and the US; and ‘middle-income G20’ includes Argentina, Brazil, China, Indonesia, India, Mexico, Russia, Turkey and South Africa. ‘Global’ contains all 64 countries covered by the 2022 CCE Index.
Figure A5 summarises these dimensions across country groups, including high- and middle-income G20 members. As illustrated in the figure, technology, knowledge and innovation, and finance and investment dimensions indicate the widest gaps. While middle-income G20 members’ average scores for these dimensions are still above the global averages, their scores are significantly below the G20 and high-income G20 average scores.
[b] Further details about the CCE Index are included in the appendix.
[c] The 2022 CCE Index indicator framework and examples of how this exercise applies at the CCE Performance and CCE Enablers sub-index levels are included in the appendix.
